
Don’t Choose Your Own Adventure: Understanding Middle-Class Earnings Trends

Wage gains for women and men middle-class workers have increased substantially over the last five decades.
What should we make of earnings trends in the United States? People can differ in their opinions about whether some reported trend is impressive or cause for concern, of course. However, you might think that it’s at least straightforward to determine what the relevant trend is and how to measure it. But that turns out not to be the case, and claims about what has happened to earnings range widely from significant declines to sizable gains.[1]
It’s tempting to either say that these disparate results all have merit or that they render it impossible to say anything about long-term earnings trends. However, some estimates are decidedly less relevant and more misleading than others. We need to be able to characterize the status of workers’ economic well-being in meaningful ways. Fortunately, the measurement and data issues are clear enough that careful consideration leads to fairly unambiguous conclusions about what has happened (if less clarity about why).
Consider the change in median earnings over the 50-year period from 1973 to 2023. The median refers to the earnings of the “typical” person—the one with earnings higher than half the population and lower than half the population. In a yearly supplement to the federal Current Population Survey, which I’ll analyze here, everyone above the age of 14 is asked about their earnings.[2] Earnings include the wage and salary income of employees as well as self-employment income (after business expenses).
The most naïve approach to the question is to simply compare the earnings of all people in 1973 and 2023. It turns out that the median person over the age of 14 in 2023 had earnings 11 times higher than the 1973 median. To be clear, we are not anything like 11 times as rich as we were fifty years ago. But how much better off are we? We’ll need a series of adjustments to arrive at the most meaningful answer, but feel free to skip to the conclusion if you’re not interested in the journey. The gist is that the median man is 40 to 50 percent better off than he was in 1973, and the median woman is doing more than twice as well as she did fifty years ago.
Step One: Account for Inflation (First Pass)
So, how do we get a more reasonable answer to the question of how much median earnings have risen? To start with, the cost of living has, of course, risen over the past fifty years; a dollar today buys less than it did in 1973. When examining earnings trends, it is essential to adjust “nominal” values for inflation to account for the declining purchasing power of the dollar. I’ll start off by using the “personal consumption expenditures price index,” (PCEPI), though I’ll revise this choice below.[3] According to the PCEPI, the cost of living rose by more than a factor of five. Still, if we look at median inflation-adjusted earnings for all Americans age 15 and older, it more than doubled between 1973 and 2023, rising 113 percent over 50 years.
Step Two: Separate Women and Men
That figure combines men and women, and their earnings trajectories look quite different. Median earnings among women rose 44-fold, while the figure for men fell by 18 percent. To be clear, neither of these estimates reasonably depicts well how women or men have fared, but trends between the two groups will continue to differ as we get closer to the best depiction. (Use Tables 1 and 2 to follow along as we go. Figures 1 and 2 show the trends for the inflation-adjusted pre-tax estimates.)
Step Three: Address Non-Workers, Part-Year Workers, and Part-Time Workers
The figures so far have included everyone at least 15 years old, whether they have earnings or not. That includes retirees, as well as teenagers and young adults in school. It includes the disabled and sick. It includes homemakers. Moreover, it includes part-year and part-time workers. If the relative sizes of these groups change over time, that can affect earnings trends.
For instance, a basic reason why women older than 14 saw a 4,316 percent increase in median earnings is that nearly half of them had no earnings at all in 1973. Among those who were employed, many worked only part-time, part of the year, or both. Today, there are many fewer homemakers than fifty years ago — a change that reflects increased economic opportunities for women and cultural shifts in gender roles.
More generally, if we are interested in how the economy is doing for workers, it may make sense to exclude from the analysis people who are too sick or disabled to work or people who have chosen to be in school, retirement, or to handle domestic responsibilities. At the same time, some people work only part-time, part of the year, or not at all due to labor market conditions, the availability of safety net benefits, or the interaction between the two. If labor supply isn’t entirely voluntary or is affected by policy incentives, that complicates the question of how to convey what has happened to earnings.
As a first attempt to address this issue of changing labor supply, we can confine the analyses to Americans of prime working age. Excluding the youngest and oldest age groups, focusing on people between the ages of 25 and 54, partly addresses several labor supply complications. These issues include rising school enrollment, changing norms related to teen employment, declining fertility and delayed childbearing, and earlier retirement.
After confining to this narrower group, rather than women’s median earnings rising by a factor of 44, it increases by a factor of eight to nine — from $4,400 in 1973 (expressed in terms of 2023 purchasing power) to $38,000 fifty years later. Among prime-age men, median earnings fell not by 18 percent, but 3 percent (from $55,300 to $53,600).
Table 1. Median Earnings and Compensation Trends, Women, 1973-2023
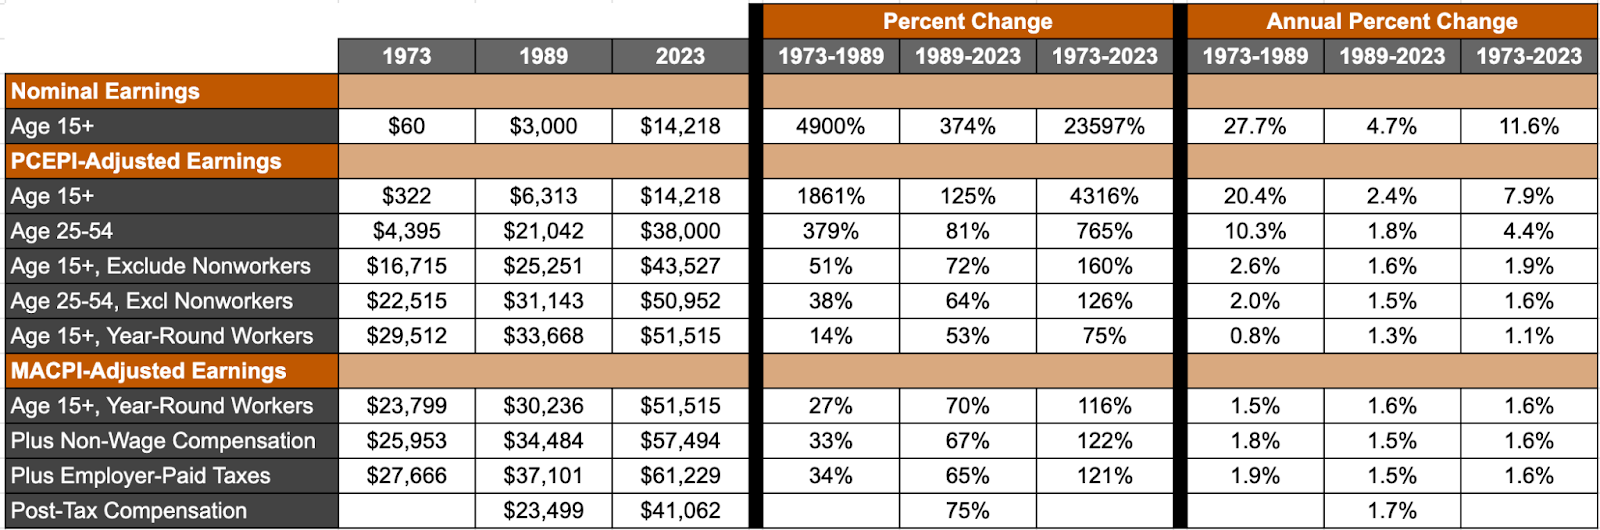
Source: Authors’ analyses of the Annual Social and Economic Supplement to the Current Population Survey. The 1989-2023 trend is adjusted for an administrative break in the CPS between 2013 and 2015, as described in the appendix.
Table 2. Median Earnings and Compensation Trends, Men, 1973-2023
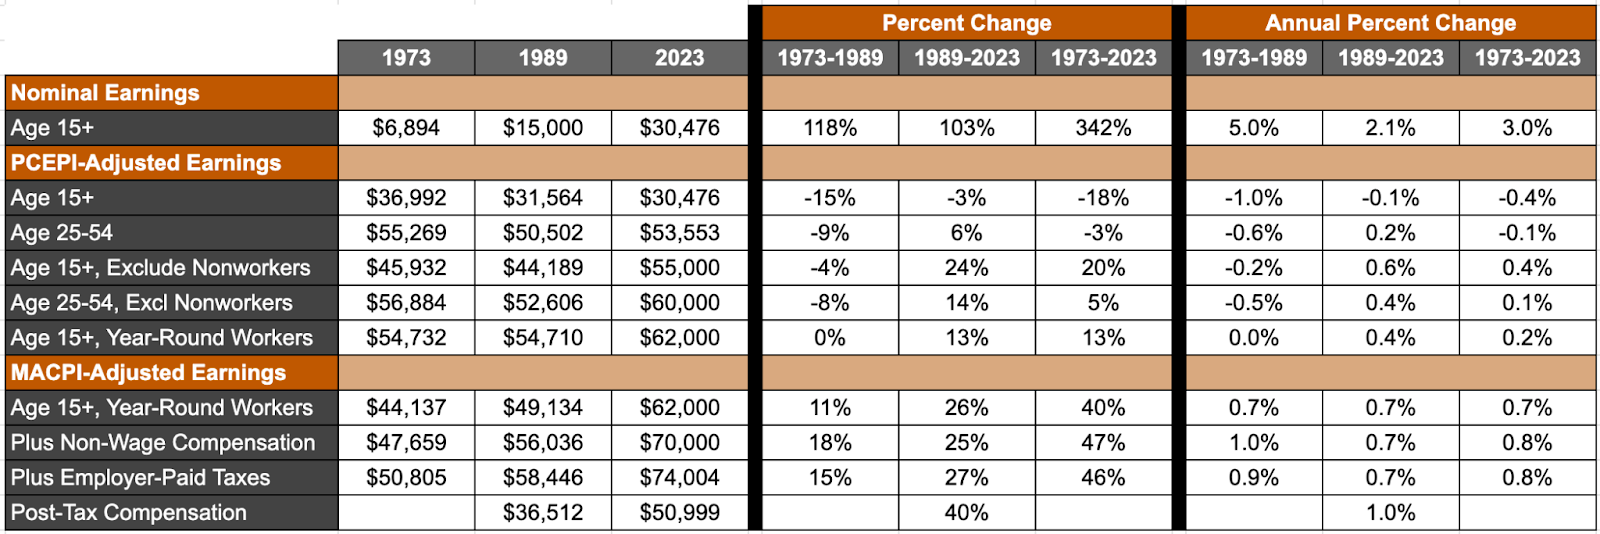
Source: Authors’ analyses of the Annual Social and Economic Supplement to the Current Population Survey. The 1989-2023 trend is adjusted for an administrative break in the CPS between 2013 and 2015, as described in the appendix.
Figure 1. Median Inflation-Adjusted Pre-Tax Earnings and Compensation, Women, 1973-2023

Source: Authors’ analyses of the Annual Social and Economic Supplement to the Current Population Survey.
Figure 2. Median Inflation-Adjusted Pre-Tax Earnings and Compensation, Men, 1973-2023
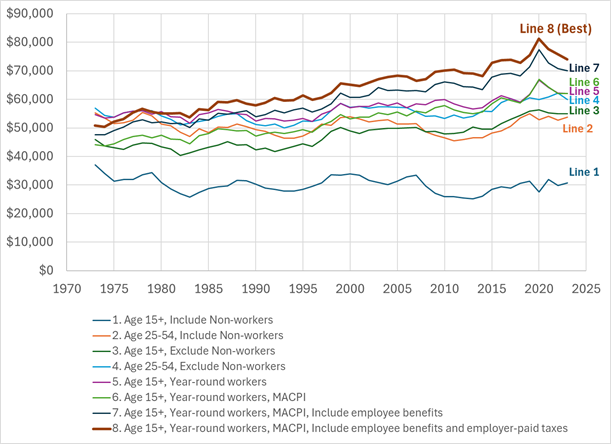
Source: Authors’ analyses of the Annual Social and Economic Supplement to the Current Population Survey.
These estimates still include nonworkers, as well as part-year and part-time workers. All we have done is exclude age groups within which such adults are overrepresented. Rather than restricting to prime-age workers, we can go back to looking at all workers older than 14, except this time exclude those with negative earnings.[4] Among women, the increase in the median is smaller than before, but the rise from $16,700 to $43,500 was still 160 percent, while men’s median earnings rose 20 percent (from $45,900 to $55,000). Restricting to prime-age adults while dropping nonworkers produces yet another set of estimates: a 126 percent rise among women, and a 5 percent increase among men.
In a supplementary appendix, I describe experiments I conducted to determine the most effective way to address the issues created by the changing number and nature of nonworkers, part-year workers, and part-time workers. The best compromise is to examine trends for year-round workers (including part-time workers) aged at least 14 years old.[5] Doing so, the increase in median earnings for women was 75 percent from 1973 to 2023 ($22,000), and it was 13 percent for men ($7,300). These are not yet the best estimates, but we are getting closer.
Interlude: Understand the Trajectories of Earnings
Before we turn to the next set of adjustments, it’s worth making a point about the basic shapes of these 50-year trends. Imagine that median earnings were the same in 2023 as in 1973 among some group, so that the 50-year increase was 0 percent. The implications of this long-term trend would be significantly different if median earnings remained constant every year for 50 years than if the median rose substantially for 25 years but then fell by an equivalent amount over the most recent 25 years. In the latter case, we might reasonably draw much more negative conclusions about the state of the economy. We could, at the very least, say that things are getting worse, and we would want to consider whether various economic and public policy changes are factors.
However, a third possibility is that the median might have fallen for 25 years but then experienced an equally large recovery more recently. In that case, we might conclude that while the economy was underperforming for a stretch, that period has receded into the distant past, and things are on the upswing. We would not want to blame economic or policy factors from the past 25 years for “stagnation.”
These distinctions are particularly relevant to trends in male earnings. If we compare business cycle peaks for the median earnings of men working year-round, we find that the median rose 17 percent from 1973 to 2021.[6] But if we look at changes between each business cycle peak, median earnings were flat from 1973 to 1979 and flat between 1979 and 1988. They rose by 0.3 percent per year from 1988 to 2000, then by 0.3 percent per year from 2000 to 2007, and subsequently by 0.7 percent annually from 2007 to 2021.
All told, as shown in Table 2, during the 16 years from 1973 to 1989, men’s earnings were flat, but during the 34 years from 1989 to 2023, they rose by 0.4 percent per year. The biggest problem for men over the past 50 years was a period of stagnation or decline that ended 40 years ago, with 1983 marking its low point. Millennial and Gen Z social-media-fueled complaints about the economy aside, it was baby boomer men who experienced historically low earnings growth.
Step Four: Account for Inflation (More Accurately)
The picture is better than these figures would suggest, because the PCEPI overstates the increase in the cost of living. In a recent paper, I summarized the evidence supporting this conclusion, reviewed studies on the magnitude of bias in popular price indexes, and documented the statements of federal statistical agencies that prefer certain measurement choices over others in assessing inflation.[7] I concluded that the PCEPI overstates the rise in the cost of living by about 0.4 percentage points every year. Over extended periods of time, this has a sizable impact on measured inflation, and it makes earnings and income trends look worse than they truly have been. The paper developed a “more accurate consumer price index” (MACPI) based on evidence of bias in conventional measures.
I subsequently validated the MACPI against long-term trends in the subjective belief that one’s family is better off financially than their parents were at the same age.[8] It is possible to measure the share of adults who objectively have higher inflation-adjusted income than their parents did. However, the level and trend differ depending on the inflation measure used. I showed that using the MACPI to adjust for inflation produced trends and levels of “absolute mobility” that more closely matched trends and levels of subjective feelings of having experienced absolute mobility.
When we use the MACPI to adjust for the rise in the cost of living, median earnings among women who worked year-round rose between 1973 and 2023 not by 75 percent, but by 116 percent. Instead of rising by 13 percent, male year-round workers’ earnings rose by 40 percent. These are increases of $27,700 for women and $17,900 for men. Men’s earnings rose 0.7 percent per year from 1973 to 1989 and 0.7 percent per year from 1989 to 2023.
Step Five: Account for Non-Wage Compensation
Earnings measures don’t include the full compensation that workers receive from their employers. Those employers are largely indifferent between paying employees $1,000 in wage and salary income and paying them $1,000 in health care or retirement benefits. But only the wage and salary income is included in earnings in the CPS and most other surveys.
We can adjust median earnings estimates to account for non-wage compensation by multiplying all employees’ wage and salary income by the ratio of aggregate compensation to aggregate employee earnings, as reported in the national accounts data.[9] (The earnings of the self-employed are unadjusted.) This approach assumes that the aggregate ratio is appropriate for adjusting all workers’ incomes, and that it is the same for less-paid workers as for higher-paid workers. In previous work, I tested this assumption and found considerable evidence to support it.[10]
The median compensation of year-round female workers rose by 122 percent from 1973 to 2023—a bit more than the 116 percent increase in earnings. Among men, the increase bumped up from 40 percent for earnings to 47 percent for compensation. In dollar terms, these were increases of $31,500 for women and $22,300 for men over fifty years.
Step Six: Account for Earnings Taxed Away by Corporate and Payroll Taxes
Conventional measures such as those presented so far are “pre-tax” in the sense that they reflect earnings before deducting the income and payroll taxes that are statutorily imposed on employees and the self-employed. Looking at pre-tax earnings is entirely appropriate if we are mainly concerned about how labor markets and employers deliver to workers, apart from the question of how tax policy then affects what they have left to spend or save.
However, at least some fraction of the corporate income and payroll taxes assessed on employers comes at the expense of worker pay. If those taxes were to disappear tomorrow, some of the savings to firms would be allocated to profits, but much of it would be passed on to workers. In this sense, conventional earnings measures are not entirely “pre-tax”, because we see the earnings paid to workers only after corporate income and payroll taxes have been deducted. These measures are effectively “pre-individual-tax, post-employer-tax” estimates.
The next set of adjustments, therefore, adds back not only nonwage benefits to wage and salary income of employees, but employer-paid payroll taxes and 25 percent of corporate income taxes.[11] These adjustments are again based on aggregate data and assume that the ratio adjustment is appropriate for all workers.[12] Among women year-round workers, this measure of full compensation once again shows an increase of 121 percent from 1973 to 2023 ($33,600), while the increase among men is 46 percent ($23,200).
Optional: Deduct Taxes
While we may be interested in the question of how markets are serving workers, we might also want to know how much workers have to spend and save after the state claims some of what they earn. Answering this question requires examining post-tax compensation, which is possible using the CPS estimates from 1980 onward. I estimate the federal and state income taxes applied to earnings, as well as the employee’s share of payroll taxes (and self-employment taxes).[13] I subtract these from compensation, along with employer-paid payroll taxes and 25 percent of corporate income taxes. Before taxes are deducted, median compensation rose 96 percent for year-round female workers between 1979 and 2023, and that was unchanged after taking taxes into account. Among men, the median rose 33 percent before taxes are deducted and 38 percent after.
Step Seven: Separate by Age Group
We saw earlier that restricting the age group to prime-working-age adults and excluding non-workers both have independent effects on earnings trends. Among men, for instance, excluding non-workers made the earnings trend stronger. Restricting to prime-age men also strengthened the trend, except that when we initially excluded non-workers, restricting to prime-age men then weakened the earnings trend.
One way the choice of age range can affect trends in the median is that when birth cohorts differ in size, a larger or smaller one can influence trends among the entire group as it ages, since earnings tend to vary predictably with age. To account for this issue, we can look at trends separately for narrower age groups. Since it’s not clear that the adjustments for non-wage compensation and earnings taxed away by employer taxes should be the same for each age group, and since these adjustments did not have a significant impact on the trend estimates, I concentrate on MACPI-adjusted earnings without these additional adjustments.
As a reminder, among women who worked year-round, median earnings rose 116 percent from 1973 to 2023, according to this measure. But as shown in Table 3, the increase was smaller for women under age 35 (ranging from 46 percent to 89 percent) than for older women, among whom the increase ranged from 111 percent to 133 percent). For men, the overall increase was 40 percent, but earnings growth generally improved steadily with age. For men 20 to 24 years old, the increase was just 17 percent, while it was 62 percent for men 60 to 64 years old.
Table 3. Median Inflation-Adjusted Pre-Tax Earnings Trends by Age Group, 1973-2023
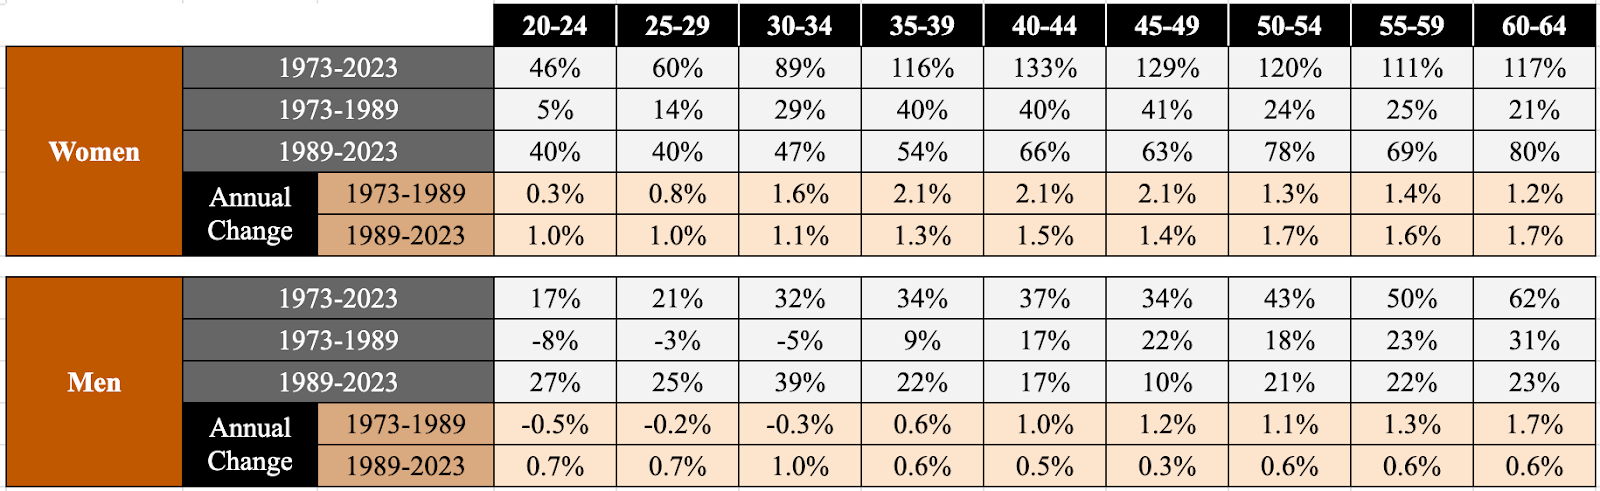
Source: Authors’ analyses of the Annual Social and Economic Supplement to the Current Population Survey.
Interesting patterns emerge when we examine the 1973-1989 and 1989-2023 periods separately. Since the two periods differ in length, it’s more informative to examine the annual percentage changes, which are also shown in Table 3. Among women, earnings rose faster after 1989 than before for the youngest and oldest workers. Women aged 30 to 49 saw larger gains from 1973 to 1989, likely reflecting increased work and career opportunities for mothers with older children.
The youngest men did worse than other groups from 1973 to 1989 but better than older groups from 1989 to 2023. Among men under 35, earnings fell during the earlier period but increased by about one-third from 1989 to 2023. Grouping all under-40 year-round male workers, median earnings rose by 28 to 29 percent from 1989 to 2023, or by $12,200 (not shown in Table 3). In contrast, the annual rates of change in Table 3 indicate that earnings growth for men aged 40 and above was significantly stronger before 1990 than after.
Aside: Other Adjustments are Possible
Of course, there are other adjustments one could make, although some are fraught with the potential to make things worse. Some analysts show median earnings trends by educational attainment. However, that tends to produce results that are too gloomy because Americans’ educational attainment has been rising. Comparing adults with less than a high school education in 1973 to the same group in 2023 captures a relatively large group in the initial year but a significantly smaller group today. Among adults ages 25 to 29, for instance, it’s essentially comparing the least-skilled 5 percent of today’s young adults to the least-skilled 25 percent in 1970.[14] A better approach is to look at trends for specific percentiles of the earnings distribution—not just the median (or 50th percentile), but the 20th and 80th percentiles, for instance. The 20th percentile of earnings refers to the earnings of the person who earns more than 20 percent of workers but less than 80 percent of workers.
Among women who worked year-round, the 20th percentile of earnings rose 105 percent from 1973 to 2023, compared with 147 percent for the 80th percentile (and 115 percent for the median). For men, the figures were 35 percent and 70 percent (and 40 percent for the median). These amounts are MACPI-adjusted and do not add nonwage compensation or employer-paid taxes to earnings.
One might argue that these long-term trends should be adjusted to reflect changing immigration patterns, too—rising immigration over the period added a steady supply of low-wage workers to the labor force. From 1993 to 2023, the data allow us to restrict the analyses to native-born Americans. Surprisingly, immigration appears to have little impact on the median trend.
Among women working year-round, median earnings increased by 59 percent overall, 59 percent among native-born women, and 60 percent among foreign-born women. The situation is somewhat more complicated for men, but still suggests that adjusting for rising immigration is unnecessary. Median earnings rose 29 percent among male year-round workers generally, 27 percent among native-born men, and 65 percent among foreign-born men. Within that native-born group, earnings rose 31 percent for non-Hispanic native-born men and 53 percent among Hispanic native-born men.
Note that these results do not answer the question of how immigration affects the wages of native-born Americans—if it lowers those wages, then in the absence of rising immigration, the median increases among the native-born would have been even larger than these figures suggest.
Finale: Do It Yourself!
I have argued here that the trend in median pay for year-round workers is a superior way to understand changes in the economic fortunes of both men and women. Tabulations of this measure are not readily available from public sources, and most people lack the background required to produce their own estimates from the publicly available data. Fortunately, the Census Bureau annually publishes a closely related measure that appears to track my preferred measure reasonably well. Specifically, “Historical Income Table P-38” presents the median pre-tax earnings of year-round and fulltime workers at least 15 years old.[15] The main difference from my preferred series is that mine includes part-time workers who worked year-round. An added bonus of the Census Bureau series is that it goes back to 1960.
Unfortunately, the published series employs an inflation adjustment that overstates the long-term rise in the cost of living.[16] However, the Census Bureau table includes nominal amounts too (unadjusted for inflation). That makes it (relatively) easy for researchers to adjust the amounts using the PCEPI or MACPI.[17] You can use an artificial intelligence, such as ChatGPT, to do it.
When I adjusted the Census Bureau amounts using the MACPI, I found median earnings rose 38 percent for men from 1973 to 2023, increasing 7 percent from 1973 to 1989 and rising 29 percent from 1989 to 2023. My own estimates for year-round workers (without adding nonwage compensation or employer-paid taxes) are 40 percent, 11 percent, and 26 percent. For women, the Census Bureau estimates rose 100 percent from 1973 to 2023, 29 percent from 1973 to 1989, and 55 percent from 1989 to 2023. My estimates rose 115 percent, 27 percent, and 70 percent from 1989 to 2023.
The published Census Bureau series also includes just-released 2024 estimates, which show the median earnings of full-time, year-round men at the same level as 2023 and the earnings of women up by two percent.
Conclusion
Without the context behind a trend, it’s easy to draw the wrong conclusion about whether the labor market is improving or deteriorating in its ability to provide well-paying jobs and whether workers are better or worse off than in the past. While we have seen that it requires a fair amount of space to convey a meaningful picture of trends, the results we’ve arrived at are straightforward to describe.
After considering complications such as inflation, non-work, part-year and part-time work, disability, nonwage compensation, and employer-paid taxes, the typical female worker earns more than twice what her counterpart did fifty years ago. The typical male worker is better off by around 45 percent compared to the 1973 standard. In terms of today’s dollars, these gains translate to about $33,600 for women and $23,200 for men who work year-round. Most of this increase occurred after 1979, totaling almost $30,000 for women and over $18,000 for men since then. After accounting for taxes, the median rose $20,200 for women between 1979 and 2023 and $14,200 for men.
These are substantial improvements. Moreover, the findings are reinforced by trends in hourly wages.[18]
Critics who wish to ignore the arguments in favor of using the MACPI to adjust for the rise in the cost of living might prefer the earnings trends presented earlier using the PCEPI, which showed men’s earnings rising by just 13 percent. Even in that case, though, it’s not that men’s pay has been flat for 50 years—it was flat and then rose. Had men’s earnings grown at the same annual rate from 1973 to 1989 that they did from 1989 to 2023, the median would have risen 20 percent over the whole 50 years rather than 13 percent—52 percent more.
In other words, MACPI skeptics who wish men’s earnings growth over the past half century had been faster have a quarrel with the 1970s and 1980s. That means that explanations for why growth wasn’t stronger have less to do with the China Shock, immigration, the global financial crisis of the aughts, the Great Recession, or rising income concentration than they do with the stagflation of the 1970s and the deep recessions of the early 1980s.
While women’s earnings growth was unambiguously strong across age groups, growth varied for men of different ages. Among men under age 30, the increase in MACPI-adjusted median earnings from 1973 to 2023 was only 24 percent rather than the 40 percent for all men using the same measure of earnings. But again, the problem here dates to the 1970s and 1980s. Young men’s earnings fell 2 percent from 1973 to 1989 but rose 26 percent from 1989 to 2023. Since 1989, men’s earnings growth has been stronger for younger men than for older men.
A plausible and straightforward explanation for the male trends emerges from the interaction of trends in men’s educational attainment and women’s labor force participation. If we look at older men, between 1973 and 1989 the share who graduated from college rose relatively rapidly. For instance, 21 percent of 45- to 49-year-olds who worked year-round in 1973 had a bachelor’s degree, while that was true of 32 percent of such men in 1989. That was an 11-point increase over 16 years. This increase in human capital was layered onto the relatively high levels of experience possessed by older workers, and because of historical patterns of female labor force participation, these men faced relatively low levels of competition for the best jobs. The result was solid earnings growth.
In contrast, from 1989 to 2023, educational attainment rose more modestly for older male workers. By 2023, the college graduation rate had risen by another 10 points to 42 percent, but spread over 34 years rather than the 16 years from 1973 to 1989. Meanwhile, there were many more experienced and well-educated older women in the workforce, competing for the best jobs. Earnings growth for men slowed.
Switching to younger men, the story looks quite different. The college graduation rate for men 25 to 29 years old who worked year-round was 24 percent in 1973, but just slightly higher at 26 percent in 1989. Stagnant educational attainment, low levels of work experience, and rising competition from young women with greater professional opportunities were a recipe for male earnings declines.
However, from 1989 to 2023, the college graduation rate among men aged 25 to 29 increased by 11 percentage points. Combined with stabilized professional competition from young women (and the temporary 1990s productivity boom), that was enough to produce strong earnings growth.
Otherwise, two other factors seem likely to be important in explaining the pre-1990 decline in the earnings of young men.[19] First, young boomer men during this period of societal transition may have been the first generation not to receive what I have called “breadwinner rents”—pay over and above their value to an employer, a bonus rooted in the paternalistic norm that men should ideally be sole breadwinners of their families. Second, the decline in marriage and fertility left an increasing share of young men without family responsibilities, which could have reduced their incentives to maximize earnings and invest in human capital.
Solutions to the economic problems of contemporary men that focus on international trade, lack of union jobs, immigration, opioid addiction, safety net policies, the absence of a national industrial policy, “financialization” of the economy, rising income concentration, explosive housing costs, higher education debt, or other changes over the past 35 years may have their merits. However, these issues are irrelevant as explanations for stagnant or declining male earnings, for the simple reason that no such trend has existed for over 35 years, rendering them unnecessary.
Scott Winship is Senior Fellow and Director of the Center on Opportunity and Social Mobility at the American Enterprise Institute (AEI).
[1] For two examples, see Phil Gramm and John Early, “The Myth of ‘Wage Stagnation,” Wall Street Journal, May 17, 2019, https://www.wsj.com/articles/the-myth-of-wage-stagnation-11558126174 and Michael Greenstone and Adam Looney, “Trends,” Milken Institute Review 13(3): 8-16, 2011, https://www.hamiltonproject.org/assets/files/milken_reduced_earnings_for_men_america.pdf.
[2] All estimates cited are from my analyses of the Annual Social and Economic Supplement (ASEC) to the Current Population Survey (CPS). The ASEC (usually administered in March) includes questions about the income that household members ages 15 and up received in the previous calendar year. The data for 1973 through 1986 come from files provided by the Unicon Research Corporation, a company no longer in existence, while data for later years are from files offered by the Minnesota Population Center at the University of Minnesota. See See Unicon Research Corporation, “Current Population Surveys, March 1962-2014,” [producer and distributor of CPS Utilities], 2014, archived website available at https://web.archive.org/web/20150212044706/http://www.unicon.com/ and Sarah M. Flood et al., Integrated Public Use Microdata Series, Current Population Survey: Version 9.0, 2021, https://doi.org/10.18128/D030.V9.0.
The 2023 data were the most recent available at the time of writing. (Data for 2024 became available from the Census Bureau but were not yet on the IPUMS website.) The estimates after 2013 have been adjusted to account for a change in survey methodology that creates an artificial break in the CPS ASEC time series between 2013 and 2015. In the 2014 survey, measuring 2013 earnings, the Census Bureau asked some people the set of survey questions that had been asked in previous years while asking others the set that would be asked in subsequent years. I adjust the post-2013 estimates by shifting them upward or downward by the difference between the 2013 estimate using the old questions and the 2013 estimate using the new questions. I exclude people living in group quarters.
[3] The PCEPI is produced by the Bureau of Economic Analysis. See US Bureau of Economic Analysis, “National Income and Product Accounts Table 1.1.9. Implicit Price Deflators for Gross Domestic Product,” https://apps.bea.gov/iTable/?reqid=19&step=3&isuri=1&1921=survey&1903=13. For a justification for using the PCEPI rather than alternatives, such as the CPI-U, R-CPI-U-RS, or chained CPI, see Scott Winship, “Introducing the ‘More Accurate Consumer Price Index’,” American Enterprise Institute, November 7, 2024, https://www.aei.org/wp-content/uploads/2024/11/price-index-working-paperFINAL.pdf?x85095.
[4] This excludes nonworkers but also a small number of self-employed people who report earnings losses and have negative earnings. These earnings losses are often not reliably reported or are strategically timed to take advantage of tax policy. They are rarely a useful guide to the material wellbeing of someone reporting them.
[5] I exclude people with negative earnings in these analyses and those that follow.
[6] I use the cyclical peak years for median men’s earnings before restricting to full-year workers, so as to account for the impact of cyclical unemployment.
[7] Winship, “Introducing the ‘More Accurate Consumer Price Index.”
[8] Scott Winship, “The American Dream is Not a Coin Flip, and Wages Have Not Stagnated,” Civitas Outlook, Civitas Institute, February 20, 2025, https://www.civitasinstitute.org/research/the-american-dream-is-not-a-coin-flip-and-wages-have-not-stagnated.
[9] See US Bureau of Economic Analysis, “National Income and Product Accounts Table 2.1. Personal Income and Its Disposition”.
[10] Scott Winship, “Bringing Home the Bacon: Have Trends in Men’s Pay Weakened the Traditional Family?” American Enterprise Institute, December 14, 2022, https://www.aei.org/research-products/report/bringing-home-the-bacon-have-trends-in-mens-pay-weakened-the-traditional-family/.
[11] I allocate 25 percent of corporate income tax to workers following the Joint Committee on Taxation, the Congressional Budget Office, and Gerald Auten and David Splinter. See Gerald Auten and David Splinter, “Income Inequality in the United States: Using Tax Data to Measure Long-Term Trends,” Journal of Political Economy 132(7): 2179-2227, July 2024, Online Appendix, https://davidsplinter.com/AutenSplinter-Tax_Data_and_Inequality_onlineapp.pdf.
[12] Aggregate employer-paid payroll taxes comes from US Bureau of Economic Analysis, “National Income and Product Accounts Table 2.1. Personal Income and Its Disposition.” Aggregate corporate income taxes comes from US Bureau of Economic Analysis, “National Income and Product Accounts Table 3.1. Government Current Receipts and Expenditures” .
[13] For 1979 to 2023, the CPS data includes estimates of federal and state income taxes, federal payroll taxes, and federal retirement deductions. (Federal retirement deductions are unavailable in the IPUMS data for 1989, so I use the Unicon data.) These are estimated by the Census Bureau by running respondent-reported income amounts through its tax model. Since the income tax amounts apply to all income received (not just earnings), the amounts must be adjusted to the amount specific to earnings. To do so, I create tax units from household members, sum income, federal income tax, and state income tax within tax units, then apply the combined federal and state income tax rate to individual earnings of workers in each tax unit.
[14] Christina King, Scott Winship, and Adam N. Michel, “Reconnecting Americans to the Benefits of Work,” Social Capital Project SCP Report No. 5-21, US Congress Joint Economic Committee, October 2021, https://www.jec.senate.gov/public/_cache/files/47745fcc-deba-418a-b05e-9fea2a32de71/connections-to-work.pdf#page=54.11. For the educational distribution of Americans ages 25-29, see https://nces.ed.gov/programs/digest/d24/tables/dt24_104.20.asp?current=yes.
[15] See https://www.census.gov/data/tables/time-series/demo/income-poverty/historical-income-people.html, “All Races” spreadsheet. Table P-53 tracks median wage and salary income of wage-and-salary workers all the way back to 1947, but it does not appear to track my preferred measure well over the past 50 years, probably because the self-employed are excluded from the estimates in the Census Bureau table.
[16] Winship, “Introducing the ‘More Accurate Consumer Price Index.”
[17] The PCEPI is available for download at the Bureau of Economic Analysis website or through the Federal Reserve Bank of St. Louis’s FRED website. See Table 1.1.4 at or https://fred.stlouisfed.org/series/PCEPI. For the MACPI values, see Winship, “Introducing the ‘More Accurate Consumer Price Index.”
[18] Winship, “Introducing the ‘More Accurate Consumer Price Index.” Median MACPI-adjusted hourly wages of men between the ages of 25 and 54 rose by 35 percent from 1973 to 2023, while the increase was 98 percent for women.
[19] Winship, “Bringing Home the Bacon: Have Trends in Men’s Pay Weakened the Traditional Family?”; Scott Winship, “America Is Still Working,” FUSION, September 10, 2024, https://www.fusionaier.org/post/america-is-still-working.

Economic Dynamism


.jpg)


.jpg)


.jpg)


Social Mobility Wins
When people live within an environment offering good jobs, good education, social networks, and a culture of self-improvement and hard work, they experience progress in a way that undercuts the philosophical rationale that socialists need to justify the policies they advocate.

Kevin Warsh and the Future of Fed Communication
Warsh is right that the Federal Reserve should not speak so loudly that it hears only its own echo.