.avif)
Did 'China Shock' Throw Millions of Americans Out of Work?

Scott Bessent claimed that “3.7 million Americans lost their jobs” due to the “China Shock.” However, the data he cites points in a different direction.
In a Wall Street Journal op-ed Monday, Treasury Secretary Scott Bessent claimed that “3.7 million Americans lost their jobs” due to the “China Shock”—the increased import competition occurring after China was granted membership in the World Trade Organization. He cites research by David Autor, David Dorn, and Gordon Hanson, linking to two of their papers. But it appears that Secretary Bessent’s numbers use a calculation not in those papers. His 3.7 million total is likely too large by a factor of at least two to four, and the actual impact of increased trade with China may have been to boost manufacturing employment.
What’s more, the underlying Autor, Dorn, and Hanson estimates that appear to be the basis for his calculations have issues.
We’ll come back to Secretary Bessent and his sources, but first, let’s consider trend evidence examining whether increased trade with China has caused job loss among American workers.
Manufacturing Has Employed a Falling Share of the Workforce For 70 Years—Throughout the Rich World
Secretary Bessent’s lament came about a month after United States Trade Representative Jamieson Greer asserted, in testimony before the Senate Finance Committee, that “The United States has lost 5 million manufacturing jobs” since 1994.
It’s not clear where Ambassador Greer got that figure. He presumably chose 1994 because that was the year the North American Free Trade Agreement (NAFTA) went into effect. Data from the “establishment survey”—arguably the best source for employment statistics—indicates that manufacturing employment fell by 4.2 million from 1994 to 2024, or 16 percent less than Greer claimed.
From 1994 to 2019, manufacturing’s share of employment fell by 36 percent. That might seem like an indictment of NAFTA unless you know that the decline was 49 percent in Australia, 34 percent in Canada, 34 percent in Denmark, 38 percent in France, 23 percent in Italy, 32 percent in Japan, 41 percent in the Netherlands, 39 percent in Spain, 44 percent in Sweden, and 52 percent in the United Kingdom.<span id="point-1-head" scroll-to="point-1-body">[1]</span>
In fact, manufacturing as a share of employment had already fallen steadily for decades before 1994. In 1953, 37 percent of the private US workforce was employed in manufacturing. Why pick 1953? It was the postwar high (although “postwar” is perhaps not quite right because manufacturing in 1953 was goosed by the Korean War). Within a decade of the end of World War II, manufacturing jobs were on the way out.
We can take an even longer perspective using other data sources and a measure of employment that includes government workers, the self-employed, and active Armed Forces members.<span id="point-2-head" scroll-to="point-2-body">[2]</span> Manufacturing employment reached its peacetime peak as a share of jobs before World War I, when farmers and farm workers still outnumbered factory workers. (Note that the economy was never remotely as dominated by manufacturing as it used to be by agriculture.<span id="point-3-head" scroll-to="point-3-body">[3]</span>)
Figure 1. Manufacturing and Agricultural Share of Employment in the United States, 1890-2024

Kingdom.[1]
Indeed, manufacturing employment has been declining in all rich Western countries for over 50 years. Even in Japan, manufacturing employment has been declining for over 30 years. China received permanent normal trade relations status in 2000 and joined the World Trade Organization (WTO) at the end of 2001. Nothing in the long-term trends suggests a dramatic impact on manufacturing employment in these countries.
Figure 2. Manufacturing Share of Employment in Selected Countries, 1970-2022
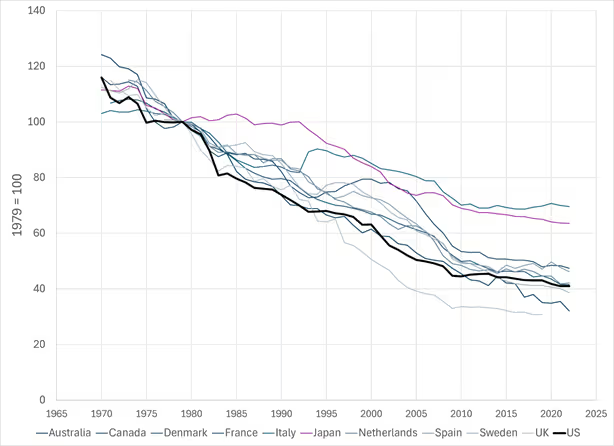
By the time China became a member of the WTO, manufacturing employment had fallen 41 percent in the US since 1977 (the first year available for all these countries), compared with between one-fifth and half among the other 10 countries in Figure 2.<span id="point-4-head" scroll-to="point-4-body">[4]</span> In seven countries, the manufacturing share of employment fell slightly faster from 2001 to 2019 than from 1977 to 2001, but the opposite was true in Denmark, the United Kingdom, and the US.
Indicators of Manufacturing Employment Decline Do Not Suggest the China Shock Changed Much
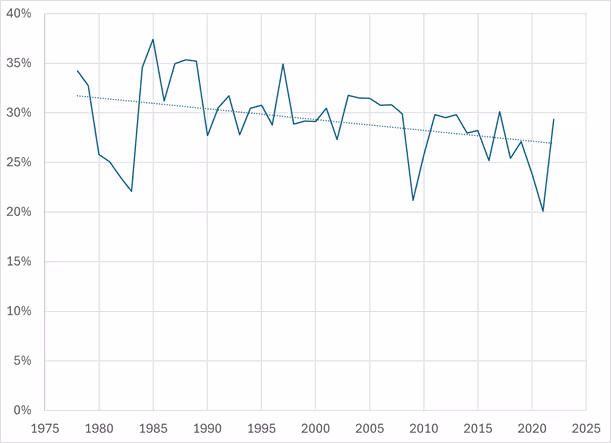
Other evidence confirms that the rate of manufacturing job destruction did not increase after China entered the WTO. The Census Bureau’s Business Dynamics Statistics data cover 1978 to 2022. We can use them to measure changes in the rate of net manufacturing job creation (increases due to expansions or openings less losses due to contractions or closures). The trend line in Figure 3 confirms the decline in manufacturing employment (it is below zero) but its flatness indicates that the rate of decrease was steady rather than accelerating after the China Shock. In fact, its flatness casts doubt on whether “shock” is even appropriate as a metaphor.
Figure 3. Net Manufacturing Job Creation Rate, 1978-2022

Contrary to the impression that the China Shock led to widespread plant closures beyond what we’d previously experienced, the evidence suggests that relatively fewer manufacturing job losses over the long run result from entire establishments closing (as opposed to job losses within surviving firms). This trend long predates the China Shock.
Figure 4. Share of Manufacturing Job Declines Due to Establishment Closures, 1978-2022
As manufacturing employment has fallen, former manufacturing workers have had less trouble finding work than in the past. According to the Current Population Survey, the unemployment rate among workers employed or most recently employed in manufacturing was 3.7 percent in March 1999 (before China joined the WTO and near the peak of a business cycle) but just 3.0 percent in March 2023. Fewer manufacturing workers are out of work and looking for a job than before the “China Shock.”
Figure 5. Unemployment Rate and Share Not in the Labor Force, Manufacturing Industry, March, 1994-2023
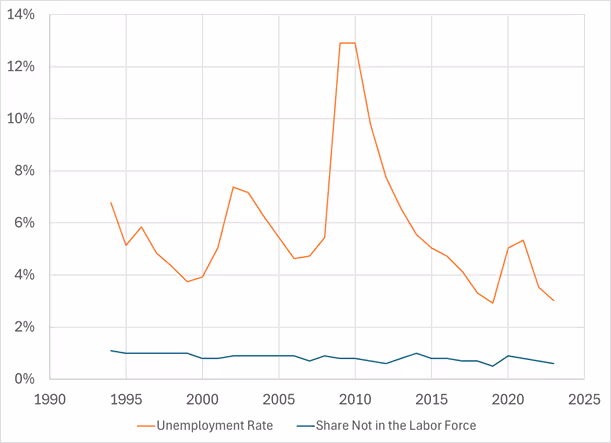
Perhaps the declining unemployment rate for former manufacturing workers hides a rising share of such workers who have dropped out of the labor force entirely? There’s little evidence of that either. We can identify former manufacturing workers outside the labor force if their last job was in manufacturing sometime in the 12 months before they were surveyed. This is a small segment when added to employed and unemployed manufacturing workers, but it fell from 1.0 percent in 1999 to 0.6 percent in 2023.
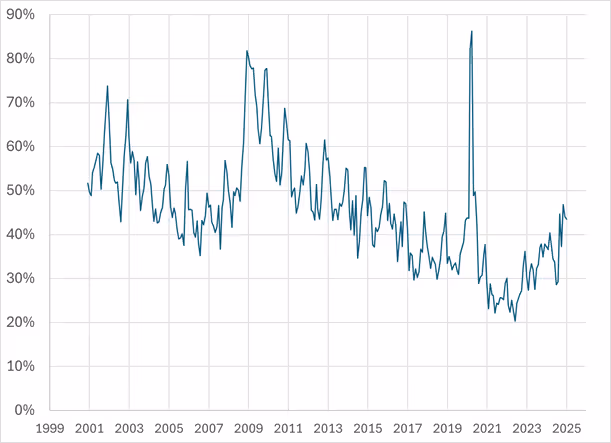
Moreover, since the China Shock, fewer workers leaving manufacturing jobs have done so due to layoffs or discharges (as opposed to voluntarily quitting). That hardly suggests that involuntary job loss in a weak labor market has increased the ranks of workers who are too discouraged to even look for employment.
Figure 6. Manufacturing Worker Discharges and Layoffs as a Share of Discharges, Layoffs, and Quits, 2001-2025
The evidence is most consistent with the long-running decline in manufacturing employment around the rich world owing to rising productivity, particularly via automation. In the US, for instance, while manufacturing employment fell by 3.6 million workers from 2001 to 2024 (or 22 percent), real manufacturing value added increased by $800 billion, or 50 percent. The reason is that labor productivity in the sector rose. Real value added per hour increased by 93 percent.<span id="point-5-head" scroll-to="point-5-body">[5]</span>
In short, American manufacturing increasingly produces more with fewer employees. But rather than more workers being involuntarily out of work, the American workforce has shifted into other sectors of the economy where demand has grown. That increased demand has been fueled, in part, by the purchasing power freed up by lower-priced goods due to automation and imports.
Where did all these workers go—into dead-end McJobs with lousy pay? Hardly. Fifteen years ago, economist Steve Rose showed that the biggest growth in employment as manufacturing’s share fell occurred in management and the professions. Those jobs rose from 18 percent of workers in 1960 to 32 percent by 2008. Of the remaining workers, the share in “less-skilled blue-collar, sale clerks, and service” jobs became smaller relative to the share in “skilled blue-collar, supervisors, and clerical” jobs. It turns out that the long decline in, first, agricultural and then manufacturing employment was really a steady upgrading of jobs that continues unabated. And as Scott Lincicome recently noted, even if we just look at the traditionally male blue-collar sector, manufacturing doesn’t pay especially well relative to other jobs. Figure 7 riffs off a chart in his excellent complementary piece to the current one.<span id="point-6-head" scroll-to="point-6-body">[6]</span>
Figure 7. Real Average Hourly Earnings, Production and Nonsupervisory Workers, by Sector, 1972-2024

What About the “Autor Research”?
But what about the Autor, Dorn, and Hanson research showing large job losses from the China Shock? One of us (Winship) recently reviewed and critiqued those papers, concluding that the effects they find are small relative to the claimed impact on community life and national politics; that the negative effects found in subsequent papers that have improved on their methods have tended to be much smaller (or occasionally positive); and that their estimates are not appropriate for quantifying the national impact on manufacturing employment.
For the gist of my critique, we can return to Secretary Scott Bessent’s claim that the China Shock destroyed 3.7 million jobs. Bessent links to a 2016 working paper by Autor, Dorn, and Hanson (henceforth, ADH) in the sentence making that claim. (That paper was published later in the year.) However, neither version supports Bessent’s claim. The paper repeats job loss estimates from another 2016 ADH paper (with Daron Acemoglu and Brendan Price). Using two different approaches, the study finds that the China Shock reduced manufacturing employment by 985,000 workers or 2.35 million workers and overall employment by 2.0 million or 2.37 million from 1999 to 2011.
Bessent appears, instead, to draw from a 2021 paper by ADH to which he links in the sentence following his 3.7 million job loss claim. (That working paper was published later in the year in the Brookings Papers on Economic Activity.) In the paper, ADH find that increased Chinese import penetration caused the share of working-age Americans employed in manufacturing to decline by 1.6 percentage points between 2001 and 2019. That was 59 percent of the actual 2.7-point decline in this ratio.
The ADH paper does not provide the estimates needed to translate this 1.6 percentage point reduction into the corresponding decline in the number of jobs, but they are readily available. In 2019, 6.4 percent of working-age Americans were employed in manufacturing in an average month—down from 9.3 percent in 2001.<span id="point-7-head" scroll-to="point-7-body">[7]</span> Had that decline been 59 percent smaller, the 2019 rate would have been 8.1 percent (a 1.2-point drop instead of 2.9 points). Given the size of the working-age population, that would have translated into 16.3 million manufacturing jobs—3.5 million more than there actually were in 2019. Bessent’s figure appears to come from a similar calculation.
However, Bessent appears to have been led astray by an error in the 2021 ADH paper. The effect that ADH have tried to estimate in their various studies is the effect of increased Chinese import penetration that reflects a “supply shock”—an increase in imports stemming from changes in China’s capacity to deliver to the US in the wake of those turn-of-the-century policy changes. But that 1.6-point decline in manufacturing employment “caused” by the China Shock incorporates an estimate of import penetration driven by a combination of supply and demand changes.
In their earlier papers, ADH reduced their initial back-of-the-envelope estimate to purge it (very roughly) of the demand-side factors (since demand for manufactured goods would have changed even absent a China Shock). But they neglected to do so in the 2021 paper that Bessent appears to rely on.<span id="point-8-head" scroll-to="point-8-body">[8]</span> In the earlier papers, the correction amounted to a 48 to 56 percent reduction in their initial job loss estimate. That suggests that Bessent’s figure is overstated by a factor of two. An estimate of 1.85 million would be more consistent with the 985,000 and 2.35 million estimates from the 2016 paper.
Bessent’s 100 percent overstatement is under the best of circumstances. Winship’s ADH critique notes that studies that have improved on the ADH methods typically find effects that are half as large as the China Shock effects ADH estimate. That would put the Bessent figure too high by a factor of four. Moreover, the effects of the China Shock in some recent papers have been positive rather than negative (for instance, because they better account for the possibility that cheap imports lower the costs of manufacturers relying on them for inputs, which may make the firms more competitive than before). And other papers that have found negative effects on manufacturing employment have found more-than-offsetting increases in non-manufacturing employment.
My critique of ADH also notes that the national estimates of manufacturing job loss offered by ADH are dubious in another important way. They are derived from applying China Shock effects that compare worse-hit geographic areas to less-exposed geographic areas. Such estimates can’t be used to estimate national job loss figures, because the cross-area comparison misses any effects that are common to geographic areas. Those effects might be negative, but they might be positive. For instance, cheap Chinese imports used as inputs into American manufacturing might have increased employment in sectors that faced less direct competition from China in the final goods they produced.
And as already noted, some studies find that the cross-area effect is positive, not negative—that manufacturing employment fared better in geographic areas more exposed to Chinese import penetration. Applying such an estimate in the way ADH do would find that the China Shock increased national manufacturing employment. That need not show up in the data as a reversal of the long-term decline; it might simply dampen that decline after 2000 relative to what would have happened in the absence of the China Shock.
Of course, it's possible that Secretary Bessent didn't use the ADH research he cited at all for his claim that 3.7 million jobs lost (despite clearly implying that was his source). As we noted earlier, the entire decline in manufacturing employment between 2001 and 2024 was 3.6 million. But no research supports the claim that the China Shock caused job losses that large.
The decline in manufacturing employment began long before the China Shock, NAFTA, President Trump's decrying of the trade deficit in the 1980s, and the trade deficit itself opening up in the 1970s. Seen in perspective, the manufacturing employment decline is—much like the earlier fall in agricultural employment—a reflection of our nation's great affluence. That doesn’t mean that this long-term decline has not been disruptive or harmful to anyone. Public policy should assist the people who bear the costs of economic change. But as Winship’s critique of ADH notes, even their own results suggest that the China Shock was less disruptive than is often implied by narratives putting it at the forefront of the current populist wave in our national politics.
Of course, many self-declared representatives of the people would have us believe that these trends can’t possibly be accurate because they are so out of line with public sentiment. But these demagogues are no more right about popular sentiment than they are about economic facts. The populists are winning for now because a charismatic leader has captured the Republican Party who happens to be obsessed with the trade deficit. The facts are not on their side, and nor, according to the polling on tariffs, is the public.
<span id="point-1-body" scroll-to="point-1-head">[1]</span> These estimates combine data for 1970-2012 on total and manufacturing employment from the Bureau of Labor Statistics International Labor Comparisons program and data for 2012-2023 from Our World in Data on manufacturing jobs as a share of employment (originally from the United Nations Industrial Development Organization and International Labor Organization). The 2012 values from the BLS data are proportionally extrapolated using the annual changes in the Our World in Data estimates.
<span id="point-2-body" scroll-to="point-2-head">[2]</span> This series uses a measure of total employment from Scott Winship, “America Is Still Working,” updated to 2024. (See end note 5 from that paper.) For 1939-2024, the manufacturing employment measure is from BLS’s Current Employment Statistics program and is an annual average of 12 months. He uses 1919-1939 estimates of production workers in manufacturing from the NBER Macrohistory Database (Table m08010b), computing 12-month averages. He scales the 1939 manufacturing employment value from BLS by the annual change in these 12-month averages, backcasting to 1919. He uses 1915-1919 estimates of factory employment from the NBER Macrohistory Database Table 08010a, which are index values pegged to 1923. Again, he computes annual averages, then backcasts the 1919 value based on annual changes. Finally, for 1889-1915, he uses Table 08005 from the NBER Macrohistory Database, which provides monthly factory employment values indexed to 1914. He again computes annual averages and backcasts the 1915 value.
<span id="point-3-body" scroll-to="point-3-head">[3]</span> Estimates of agricultural employment from 1890 to 1940 are from Susan B. Carter, “The labor force, by industry: 1800–1960 [Lebergott and Weiss].” Table Ba814-830 in Historical Statistics of the United States, Earliest Times to the Present: Millennial Edition, edited by Susan B. Carter, Scott Sigmund Gartner, Michael R. Haines, Alan L. Olmstead, Richard Sutch, and Gavin Wright. New York: Cambridge University Press, 2006. http://dx.doi.org/10.1017/ISBN-9780511132971.Ba652-103210.1017/ISBN-9780511132971.Ba652-1032. Estimates of agricultural employment from 1948 to 2024 are from U.S. Bureau of Labor Statistics, Employment Level - Agriculture and Related Industries [LNS12034560], retrieved from FRED, Federal Reserve Bank of St. Louis; https://fred.stlouisfed.org/series/LNS12034560, May 5, 2025. Total employment estimates are as described in the previous note.
<span id="point-4-body" scroll-to="point-4-head">[4]</span> The highest, 53 percent, is for the United Kingdom, where there is a break in the data between 1996 and 1997. Correcting that break might lower the decline so that it is perhaps 47-48 percent— closer to the next-highest drop, 45 percent in Australia. The lowest, 19 percent is for Italy, but there is a break in the data between 1992 and 1993. If corrected, the decline would be 26-27 percent. There is also a break in the US data between 1982 and 1983. The estimates in Figure 1 indicate a decline of 38 percent.
<span id="point-5-body" scroll-to="point-5-head">[5]</span> Estimated by comparing the change in real value added to the change in hours in the sector from Bureau of Labor Statistics data on the change in hours worked by manufacturing workers.
<span id="point-6-body" scroll-to="point-6-head">[6]</span> Nominal values are adjusted to 2024 dollars using the Personal Consumption Expenditures Price Index.
<span id="point-7-body" scroll-to="point-7-head">[7]</span> The number of manufacturing jobs is from https://fred.stlouisfed.org/series/CEU3000000001. The number of Americans age 18-64 is from https://wonder.cdc.gov/bridged-race-population.html.
<span id="point-8-body" scroll-to="point-8-head">[8]</span> The paper also misstates its results in the abstract and introduction, claiming that the effect of the China Shock is 1.54 percentage points rather than 1.59 and that it amounted to 55 percent of the decline in manufacturing rather than 59 percent.
Scott Winship is Senior Fellow and Director of the Center on Opportunity and Social Mobility at the American Enterprise Institute (AEI).
Bryan Riley is Director of the National Taxpayer Union’s Free Trade Initiative.

Economic Dynamism


.jpg)


.jpg)


.jpg)


Social Mobility Wins
When people live within an environment offering good jobs, good education, social networks, and a culture of self-improvement and hard work, they experience progress in a way that undercuts the philosophical rationale that socialists need to justify the policies they advocate.

Kevin Warsh and the Future of Fed Communication
Warsh is right that the Federal Reserve should not speak so loudly that it hears only its own echo.