
Work Requirements For Medicaid Could Increase Income and Reduce Poverty

Simplistic static modeling doesn't capture the gains that could likely result from work requirements.
New Congressional Budget Office figures released last week indicate that the reconciliation bill passed by the House and under review in the Senate would reduce annual income among the poorest households by $1,600. The next day, the Urban Institute released its own analyses, finding that the bill would throw an additional 1.4 million people into poverty. Much of the impact in both cases are attributed to the Supplemental Nutrition Assistance Program (SNAP) and Medicaid work requirement provisions of the bill. Opponents of work requirements have pounced. Are they justified?
First, I’m not a CBO hater at all. I think incredibly highly of Director Phillip Swagel, and I’m friendly with a few other CBO analysts. (I’m also friendly with a variety of folks at Urban.) Modeling impact is hard, and while I’ll raise questions here about CBO’s latest estimates, I can’t disagree enough with all this Republican bad-mouthing of the agency.
I’m also on record saying I think we can’t afford the bill’s tax cuts. And I think the bill should make people who lose their Medicaid coverage after being sanctioned for not working eligible for ACA subsidies.
All that aside, claims that the reconciliation bill would result in income losses for the bottom 10 percent of households and increase poverty, as CBO and Urban, respectively, have projected, are dubious. Their estimates are too negative because they neglect the potential for income gains when fewer people receive Medicaid or SNAP. Hear me out!
In the public imagination, “work requirement” means kicking existing beneficiaries off the rolls as punishment for not complying. This is consistent with the discussion of work requirements in a 2022 CBO report. Summarizing results from two studies, the report concludes that, “SNAP’s work requirement probably reduces the average income of ABAWDs [able-bodied adults without dependents] by causing many of them to stop receiving benefits.” (emphasis added) The report describes findings from two papers on Arkansas’ Medicaid experiments similarly: “Over the seven months of 2018 that the requirement was in effect, about 23 percent of Medicaid recipients who were subject to it lost coverage for failure to comply….Arkansas’ work requirement probably reduced families’ resources overall because it caused a large reduction in Medicaid coverage.” (emphasis added)
However, experience with the welfare reforms of the 1990s suggests that the most critical effect of work requirements on employment and income might operate through two other channels: encouraging people to leave the rolls before they are sanctioned and preventing people from joining the rolls in the first place. Those were certainly a key feature of the national 1996 welfare reform; states measured their success in meeting the work requirement against a baseline of the pre-reform caseload. They gained credit not simply by removing people from the rolls, but by reducing the flow of new people onto the rolls. In the end, few people lost their welfare benefits through sanctions for not working. Work requirements made receipt of benefits a less appealing proposition, and the number of people leaving the rolls swamped the number of new people joining them.
That was one reason that projections of increased poverty due to reform were so off the mark: they presumed that work requirements would push people off the rolls through sanctions and that relatively few would replace the income from lost benefits with earnings.
And, I’m sorry, I’m going to have to ding the Urban Institute here, because it provides a rather infamous example that is at the heart of my criticism of the latest CBO and Urban findings.
In 1996, Urban issued a report projecting the impact of welfare reform. Specifically, the report estimated that an earlier version of the reform bill, similar to the one that would eventually pass later that year, would result in an increase of 2.6 million people in poverty. It predicted that 1.1 million children would fall into poverty.
The authors produced these estimates using Urban’s TRIM model, which examines a snapshot of families at a single point in time. Their projection plugged in their assumptions and looked at how the number of poor people increased. The authors assumed that 80 percent of welfare recipients would be subject to the work requirement, that “two-thirds of mothers who lose welfare eligibility as a result of time limits will find jobs, most at part-time hours,” and that they would “find year-round jobs with an hourly wage of nearly $6.00.” The modeling was “static” in the sense that it effectively assumed a steady and equal flow of families on and off the rolls, all subject to work requirements while on them.
What happened in the real world is that the flow of people not waiting to be sanctioned exceeded the dramatically reduced flow onto the rolls. On net, taking into account both people who left the rolls and those who did not join, incomes among the relevant population increased.
Now, almost invariably, critics argue that rather than welfare reform, it was the strength of the late 1990s economy or other expansions of the safety net that should get full credit for preventing the catastrophe predicted by Urban. These arguments have little merit, as I have argued elsewhere. The best way to see that is to consult remarkable figures from a 2014 report produced by the Congressional Research Service (CRS), an agency created by Congress to inform Members. (All of these are from Table C-11 of the report.)
According to CRS, the poverty rate among single mothers in 1996, the year federal welfare reform was signed into law, was 37%, using a measure of income that included food stamp benefits as well as all cash transfers.
If the Urban projection that work requirements would increase poverty had been accurate, then the poverty rate should have risen, all else equal. And in 1997, it rose slightly to just under 38%. But from 1998 to 2013 (the last year in the study), the poverty rate among single mothers was lower than it was in 1996.
Now, perhaps you’re seizing on that “all else equal.” Fair! However, let’s consider the two significant changes, aside from welfare reform, that occurred during this period. First, there were safety net expansions, including reforms to the Earned Income Tax Credit (EITC) and SNAP, as well as the creation of the Child Tax Credit (CTC). But the estimates above are pre-tax, and so the EITC and CTC can’t have played a role. And single mothers were better off even without SNAP.
Consider the results if, for the years after welfare reform, we exclude from income not just SNAP, but all safety net benefits available to non-workers (including cash welfare and SSI disability benefits). That leaves only earnings, other private sources of income, and government cash transfers that require work (such as social security, unemployment insurance, and worker’s compensation). We can then compare this less generous definition of income to the same poverty thresholds as before. That is, all we are doing differently is treating people after 1996 as if they are poorer than they were because we are ignoring their safety-net benefits. And we’ll compare these post-reform rates to the 1996 rate that includes those safety net benefits in income. In other words, we’re putting a thumb on the scale against finding that things improved for single mothers.
By 1999, the poverty rate, excluding the safety net, was lower than the more generous 1996 rate. It stayed lower through 2007, until the onset of the Great Recession. Over the years, rising employment alone has been enough to reduce poverty among single mothers.
You might think that the strength of the economy—the second thing that didn’t stay equal—should get credit for this poverty decline. One way to assess this claim is to look at the year 2003. In December 1995, CBO projected the unemployment rate would be 5.9 percent in 1996 and 6.0 percent over the nine years from 1997 to 2005. (See Table 1.) That ended up underestimating the strength of the economy for the second half of the 1990s, including 1996, when the actual rate was just 5.4 percent. But CBO nailed it for 2003, when the real unemployment rate was 6.0 percent. That was 0.6 points higher than in 1996 rather than just 0.1 points higher in the CBO projections. Nevertheless, the ignore-the-safety-net poverty rate for single mothers was 35 percent in 2003—two points lower than the more generous 1996 rate.
We also can compare the ignore-the-safety-net poverty rate after welfare reform to the more generous poverty rate from 1989, which was the last business cycle peak before welfare reform. That year, the more generous poverty rate (including cash welfare, SNAP, and SSI as income) was 40%. But the ignore-the-safety-net rate was lower than that in every year from 1998 through 2009, and it was also lower in 2013. That is, for every year except the high unemployment years of 2010-2012 in the wake of the Great Recession, single mothers and their children were better off—without taking safety net benefits into account—than in the strongest economic year before welfare reform even counting safety net benefits that year. And that was before the 2010s economic expansion really kicked in.
The reason is that employment among single mothers dramatically rose in the 1990s and stayed elevated relative to pre-reform levels:
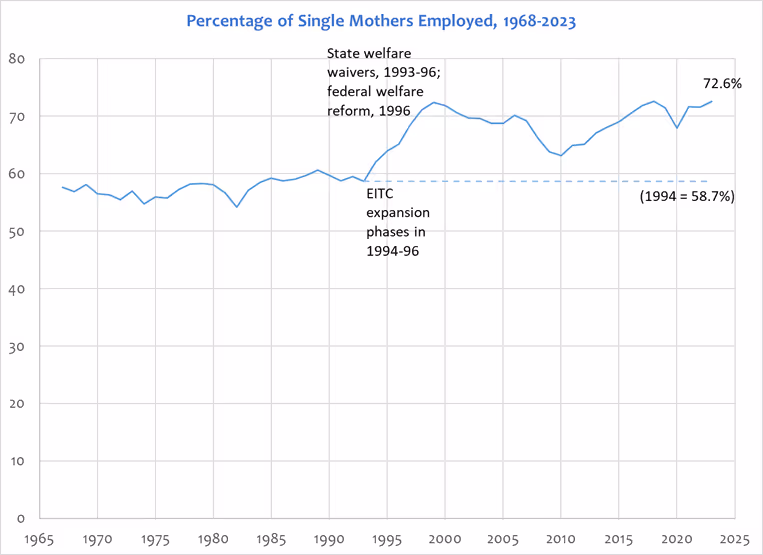
Source: Analyses of Current Population Survey Annual Social and Economic Supplement, IPUMS.org SDA Dataset.
In short, single mothers fared better after welfare reform than they ever had before welfare reform. Work—and the social insurance benefits to which work entitles people—was enough by itself to make the difference, all else equal. Work requirements were behind this development. Simplistic static modeling did not anticipate the income-increasing effects of work requirements.
Which brings us back to last week’s CBO and Urban analyses. Their models are similar in spirit to those of the Urban Institute circa 1996, being static, simply adjusting point-in-time data by tweaking incomes based on assumptions, rather than modeling more complicated flows onto and off of programs. They are more one-sided than the 1996 Urban model. They model no income gains from work requirements in the form of higher earnings. only income declines from the loss of benefits.[1]
You might object that research on SNAP or Medicaid work requirements suggests that they do not produce increases in work. However, the 1996 Urban report also justified its results based on research. That research led to the assumption that for every family that would be better off because of welfare reform, 14 would be worse off. The research ultimately failed to capture the dynamics of the real-world effects of work requirements.
If I were critical of work requirements, I’d be a little uneasy with the experience from 1996 before touting these latest estimates. The old Urban report indicated that because of welfare reform, families would lose, on net, about $12 billion in income. That’s in 1996 dollars, and today it would amount to about $22 billion. CBO now says that the bottom tenth of households would lose $1,600 per year from 2026 to 2034 (in today’s dollars). That comes out to about…$21 billion. Maybe it will be proven correct. Maybe.
If I were someone who cares about poor people—and I am!—I would carefully consider the experience of welfare reform before confidently thinking that conservative reforms will be harmful to them. (It was the very experience of thinking welfare reform would be a disaster and being proven wrong that made me more open to conservative policy ideas.)
Finally, suppose I were modeling the impact of legislation that includes work requirements, and I’m assuming that they can only lower incomes. In that case, I’d want to be very explicit about that assumption and justify it. It’s maybe not quite the whole game here, but it’s not far from that. And neither study makes that key assumption clear. Critics of the work requirement and their allies in the media are unlikely to make a concerted effort to clarify it.
[1] The CBO letter explaining its new figures notes that “macroeconomic effects” aren’t modeled and lists four channels through which incomes may be affected in its modeling, none of which mention changes in labor supply. The channel related to Medicaid and SNAP only mentions how the bill can produce income losses. Urban indicates in footnote 4 of another report on SNAP work requirements that it models no employment effect, based on three studies it cites. Of course, in 1996, Urban also cited research in arguing that welfare reform would produce greater income losses than income gains—a misfire that has not affected their assumptions in the latest modeling.
Scott Winship is a Senior Fellow and Director of the Center on Opportunity and Social Mobility at the American Enterprise Institute (AEI).

Politics
%20Richard%20Samuelson%20%20-%20Is%20American%20Nationalism%20Still%20Creed-able_-1.jpg)
Is American Nationalism Still Creed-able?
We are not there now, but there is reason to worry that the United States is in danger, if we are not careful, of ceasing to be a nation with the principles of 1776 at its core.

National Civitas Institute Poll: Americans are Anxious and Frustrated, Creating a Challenging Environment for Leaders
The poll reveals a deeply pessimistic American electorate, with a majority convinced the nation is on the wrong track.
.webp)
%20(1).avif)


Can Britain’s Next Prime Minister Escape the Net Zero Trap?
Britain has burned through five Prime Ministers and is paying some of the highest electricity prices in the world.

The Scanner at the Gate: Europe’s China Policy Litmus Test
China’s industrial policy is entering Europe through public procurement—and reshaping sensitive markets from within.

Confronting the New Antisemitism
"The postwar effort 'to rebrand Judaism as a religion' has made it impossible for American Jews to understand what they are facing today, because what we are facing today is an attack on the idea of Jewish peoplehood.”

“Democratic” Socialism Is Undemocratic
By promoting class hatred, suppressing private initiative, and seeking enhanced control of our lives, today’s democratic socialists undermine patriotism and individual initiative—two qualities that have long distinguished the United States from other major nations.

