
National Poll from Civitas Institute: Trump Victory Driven by Voters Who Reject Status Quo

The Civitas Institute Poll, conducted from November 7-12, 2024 (after the 2024 presidential election), asked 1,200 Americans an array of questions about how things are going in the country, about the status of American democracy and capitalism, and (most obviously) about the 2024 election. Here are the top six results…
Number 1: Donald Trump won the 2024 election because *slightly* more voters see him as an agent of change
Almost six in ten voters (59%) say the country is headed in the wrong direction, and they preferred Trump over Kamala Harris by just under four percentage points (49.4% Trump to 45.6% Harris). Among voters who say the country is headed in the right direction, Trump and Harris split the vote.
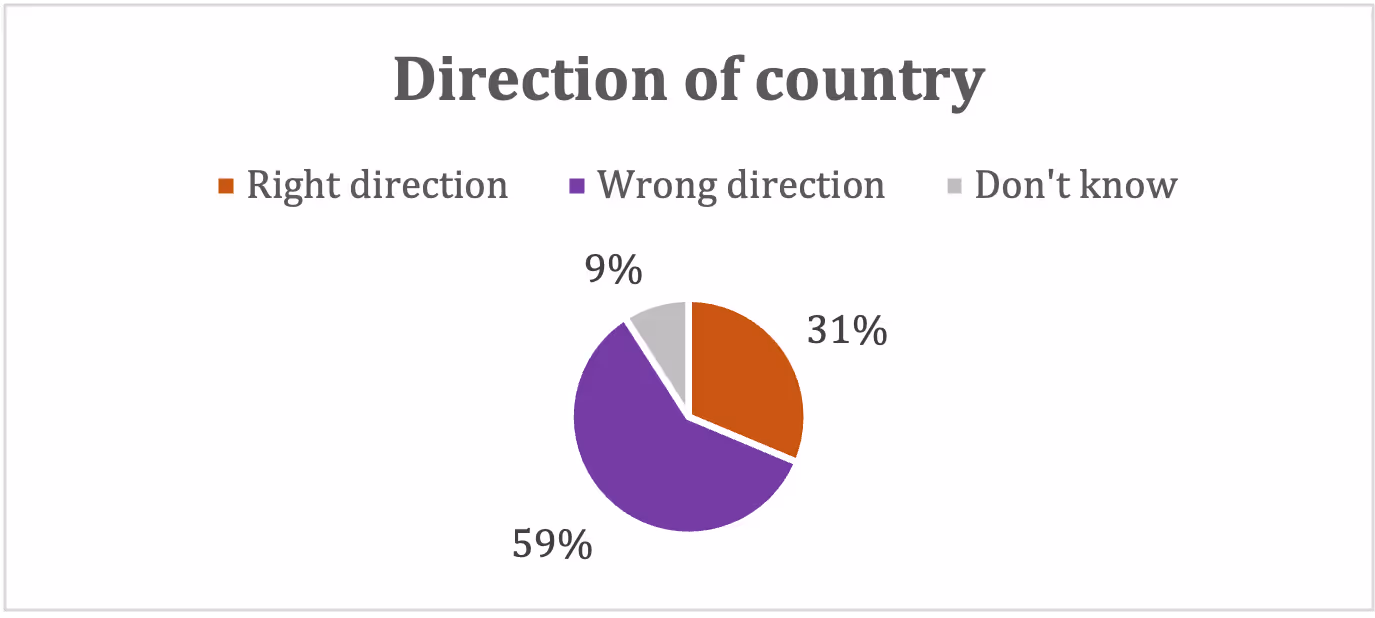
This finding highlights the fact that 2024 was an unusual “change” election, in which an incumbent vice-president was running to succeed a one-term president against the previous president. By emphasizing the need to “turn the page” and arguing that we should not “go back” to the days of Trump, Harris nearly neutralized the change issue. Trump, on the other hand, closed his campaign by arguing “they broke it, we’ll fix it.”
Beyond the “track” question, evidence that voters are dissatisfied with the country’s direction is apparent in ratings of American institutions. When asked whether they have favorable or unfavorable feelings towards various governmental and public entities, Americans were (at best) ambivalent. The Supreme Court, for example, is viewed favorably by 52% of respondents, with 21% saying they are “very” favorably inclined. Local government also fares relatively well, garnering favorable feelings from 54% of the public (13% “very” favorable). But only 31% feel favorable towards the news media (9% “very” favorable), and the ratings for the Congress (34% favorable) and the criminal justice system (40% favorable) are likewise under 50%.
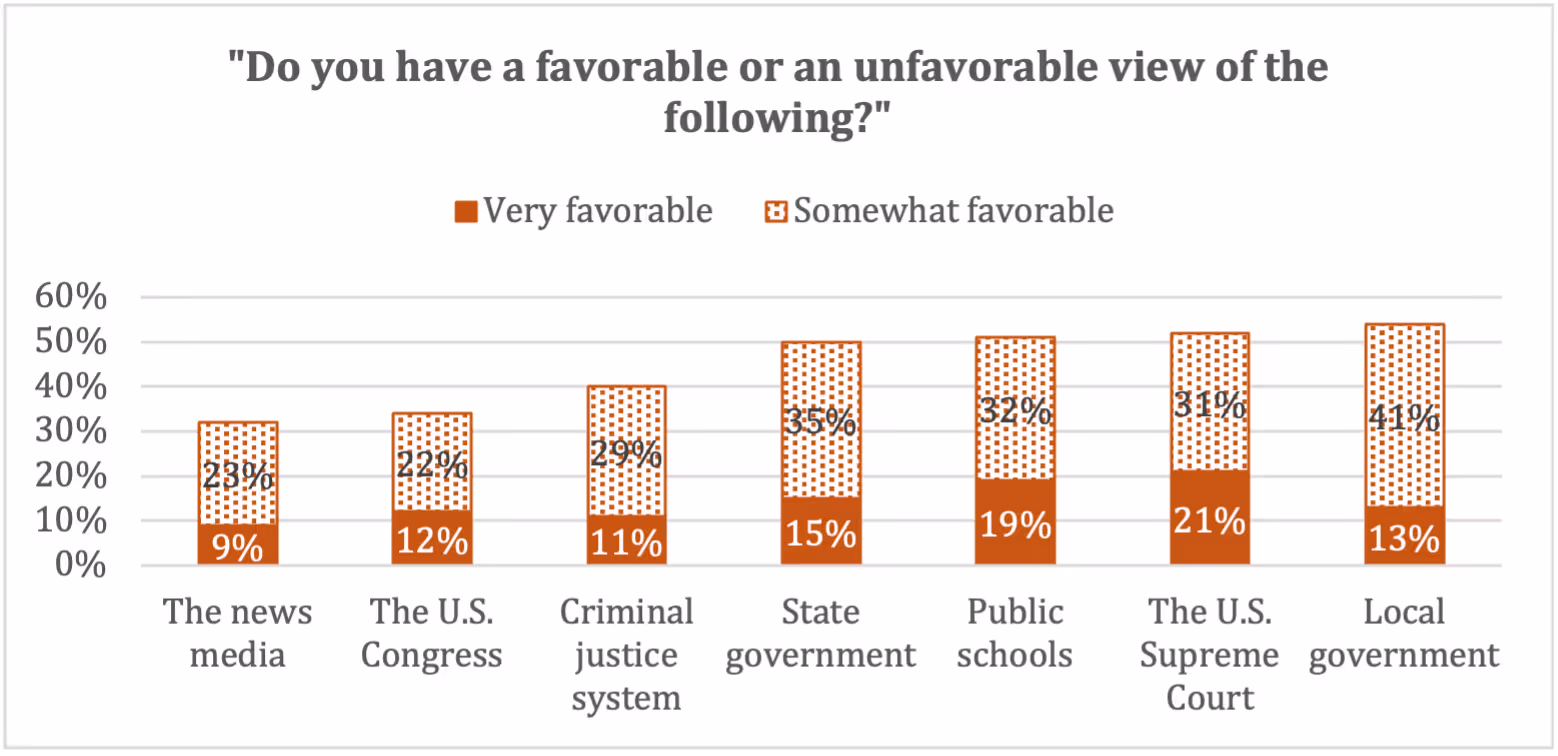
Worth reiterating, however, is that dissatisfaction did not universally help Trump. Rather, the focus of disaffection is diffuse and splinters the change vote. Among voters who were very unfavorable towards the news media, for example, Trump won 81%-15%. But among those who were very unfavorable towards the Congress, Harris won 63%-30%. And among those very unfavorable towards the Supreme Court, Harris won 90%-6%.
Number 2: Trump (mostly) won by increasing his vote among Democratic and independent constituencies
There has been a great deal of chatter about a partisan realignment in the wake of the 2024 election, which begs for social scientific clarity. Our take is that while there is no clear majority party, the data suggest that there has been a change in the social group profiles of the Republican and Democratic parties.
The Civitas Institute Poll demonstrates that the American electorate continues to shift by education and race/ethnicity. In 2024, Harris carried those with a post-graduate degree by six points and those with a four-year college degree by ten points. Trump, on the other hand, carried those with a high school degree by fifteen points. The tendency for those with higher levels of educational attainment to vote Democratic is a reversal of the patterns we see from the 1930s to the 2010s, in which Democrats dominated with less well-educated voters while Republicans had the edge with college-educated voters.
In 2024, Trump carried white voters by eleven points and lost Black and Hispanics voters by fifty-three and twelve points, respectively. Compared to 2020, Trump improved his margin among white voters by two points, among Blacks voters by three points, and among Hispanic voters by twelve points.

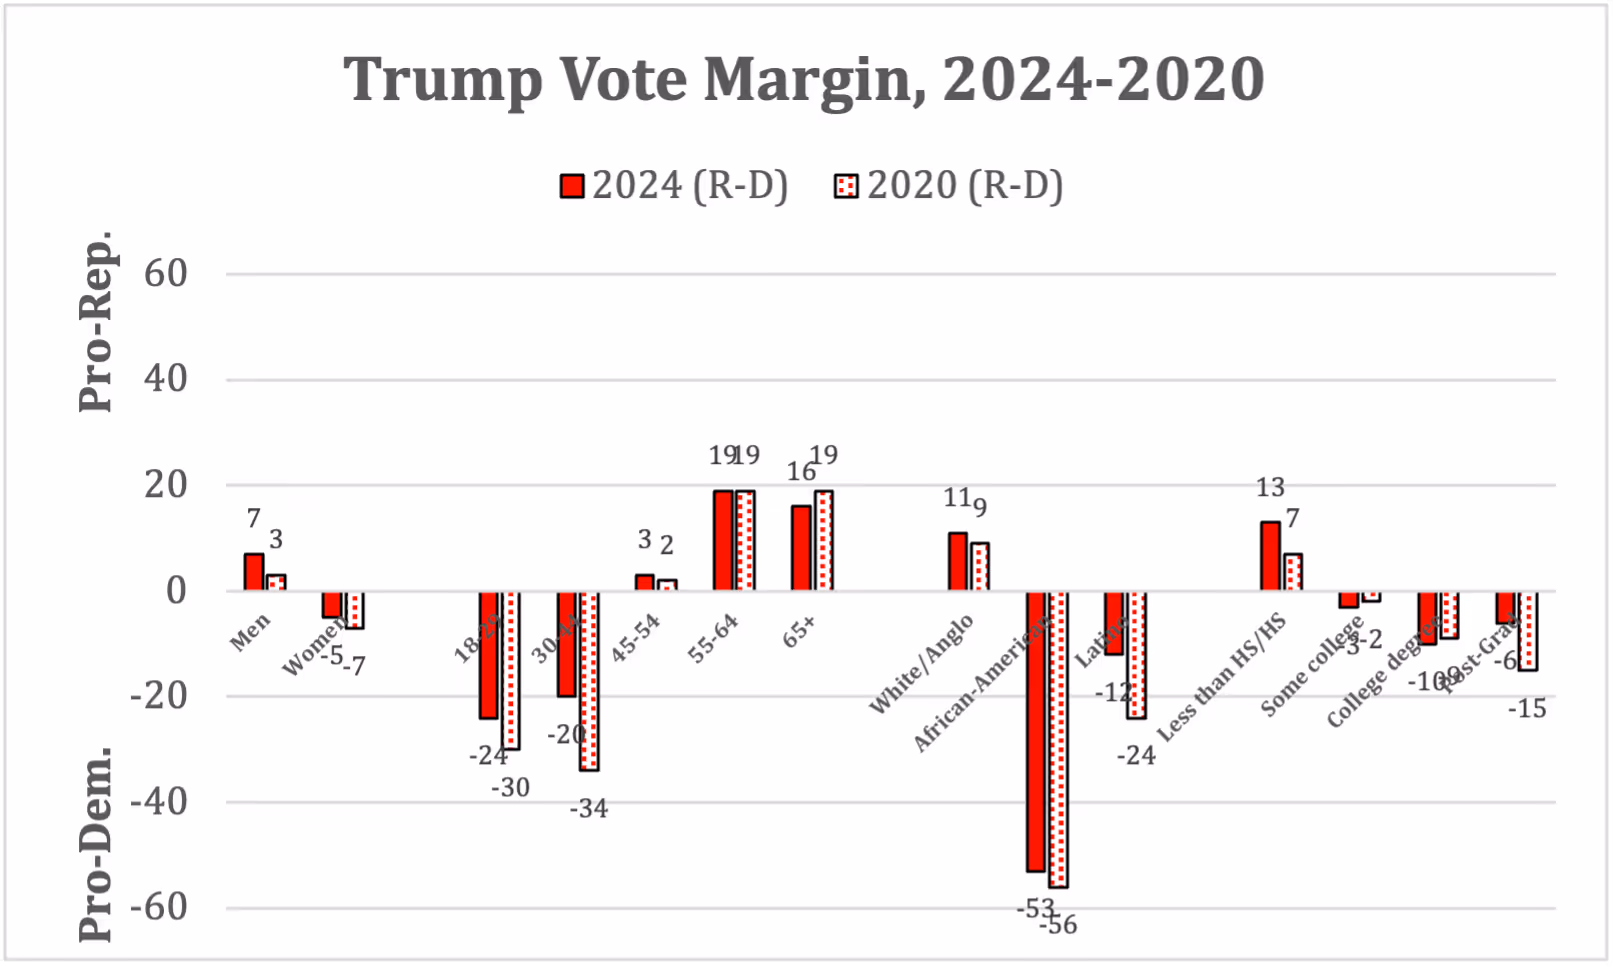
Another key to Trump’s 2024 victory is his improvement among younger voters. In 2020, he lost 18–29-year-olds by thirty points; in 2024, he lost them by twenty-four points, a six-point improvement. He did even better among 30–44-year-olds, improving his margin from losing by thirty-four points to losing by only twenty points.
The point isn’t that Trump is winning these groups. Rather, it is that Trump and the Republicans are not losing them by that much. In an evenly divided country, that can be enough to put you over the top.
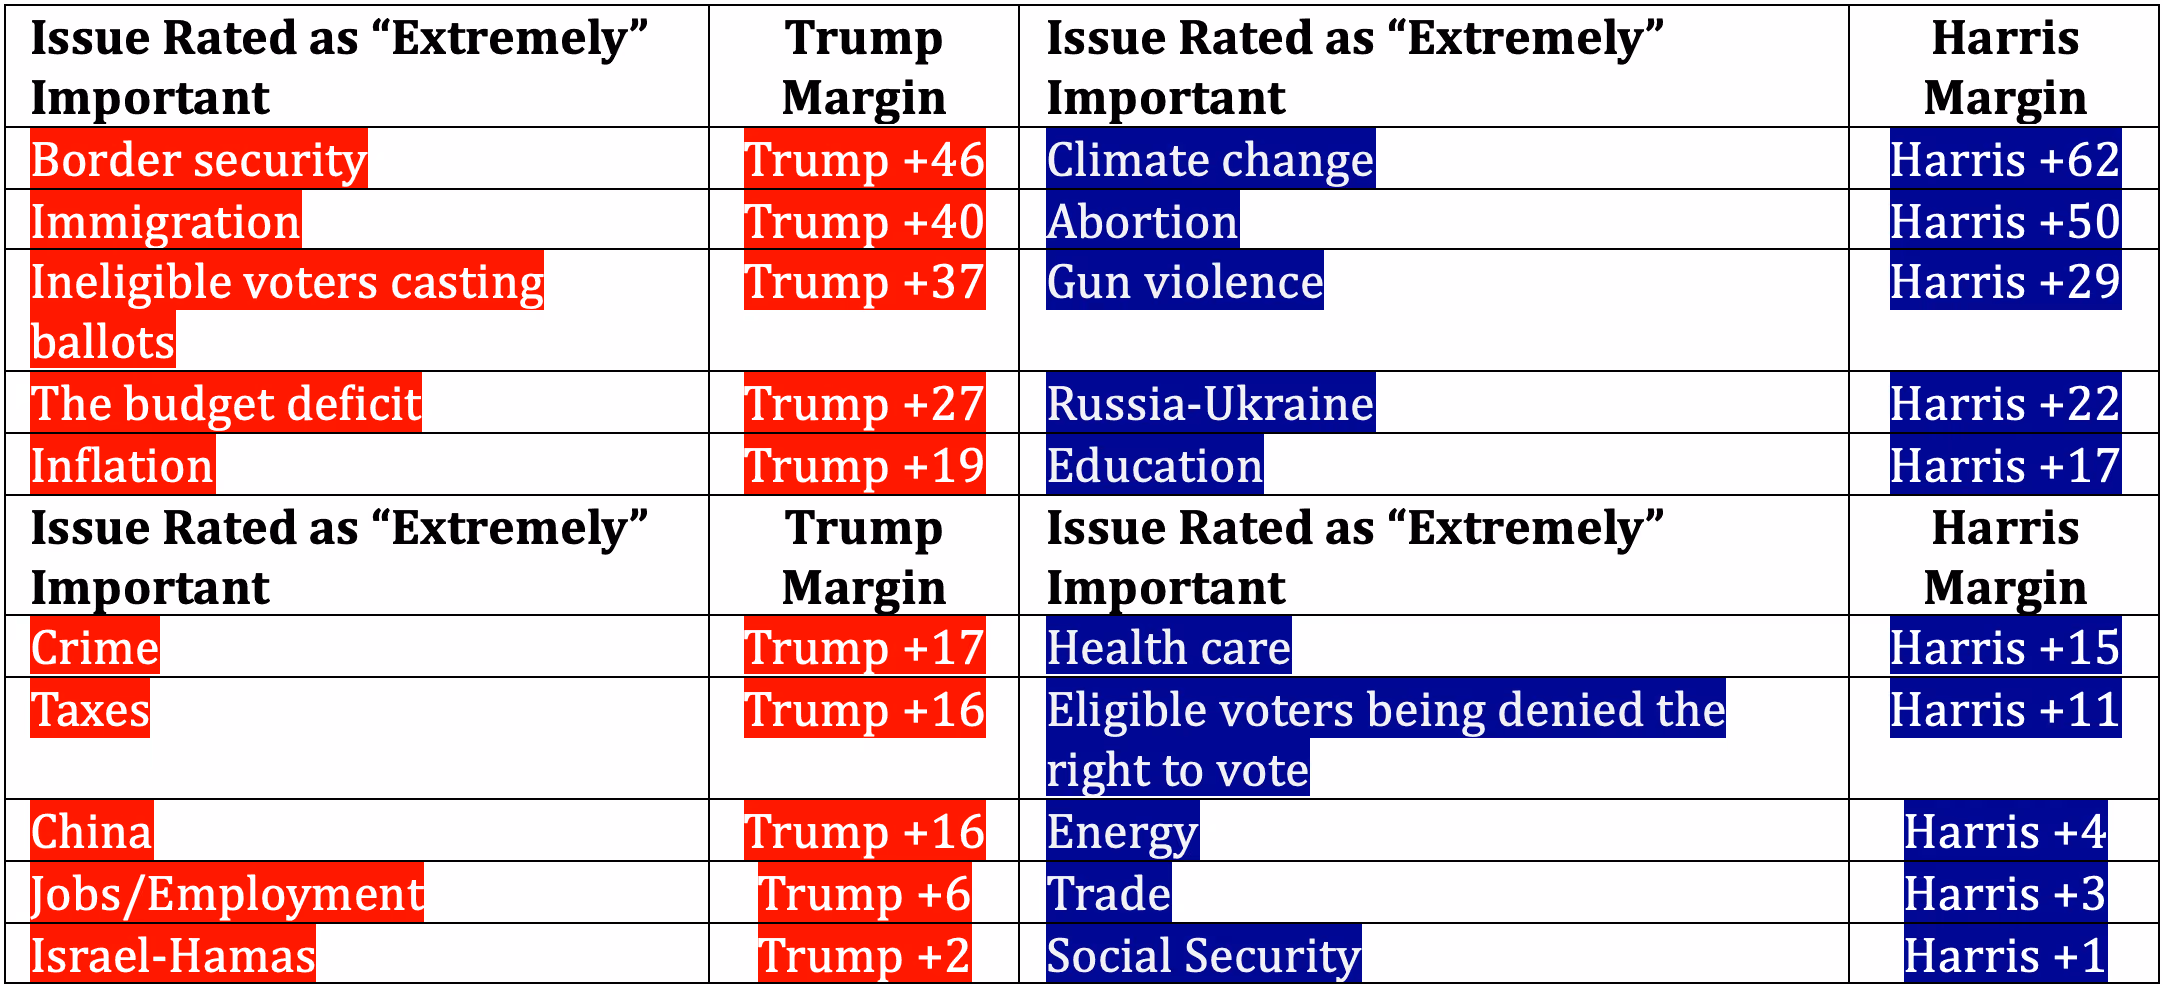
Number 3: Voters were concerned about many issues, but especially affordability
Americans expressed concern about a great many issues, but inflation and prices topped them all. Seventy three percent said the issue of prices is “extremely” important to them personally, more than six points more than the next highest issue (health care). Of the top five issues, three are overtly economic: inflation/prices, jobs/employment, and taxes/tax rates. The other two in the top five are health care and Social Security.
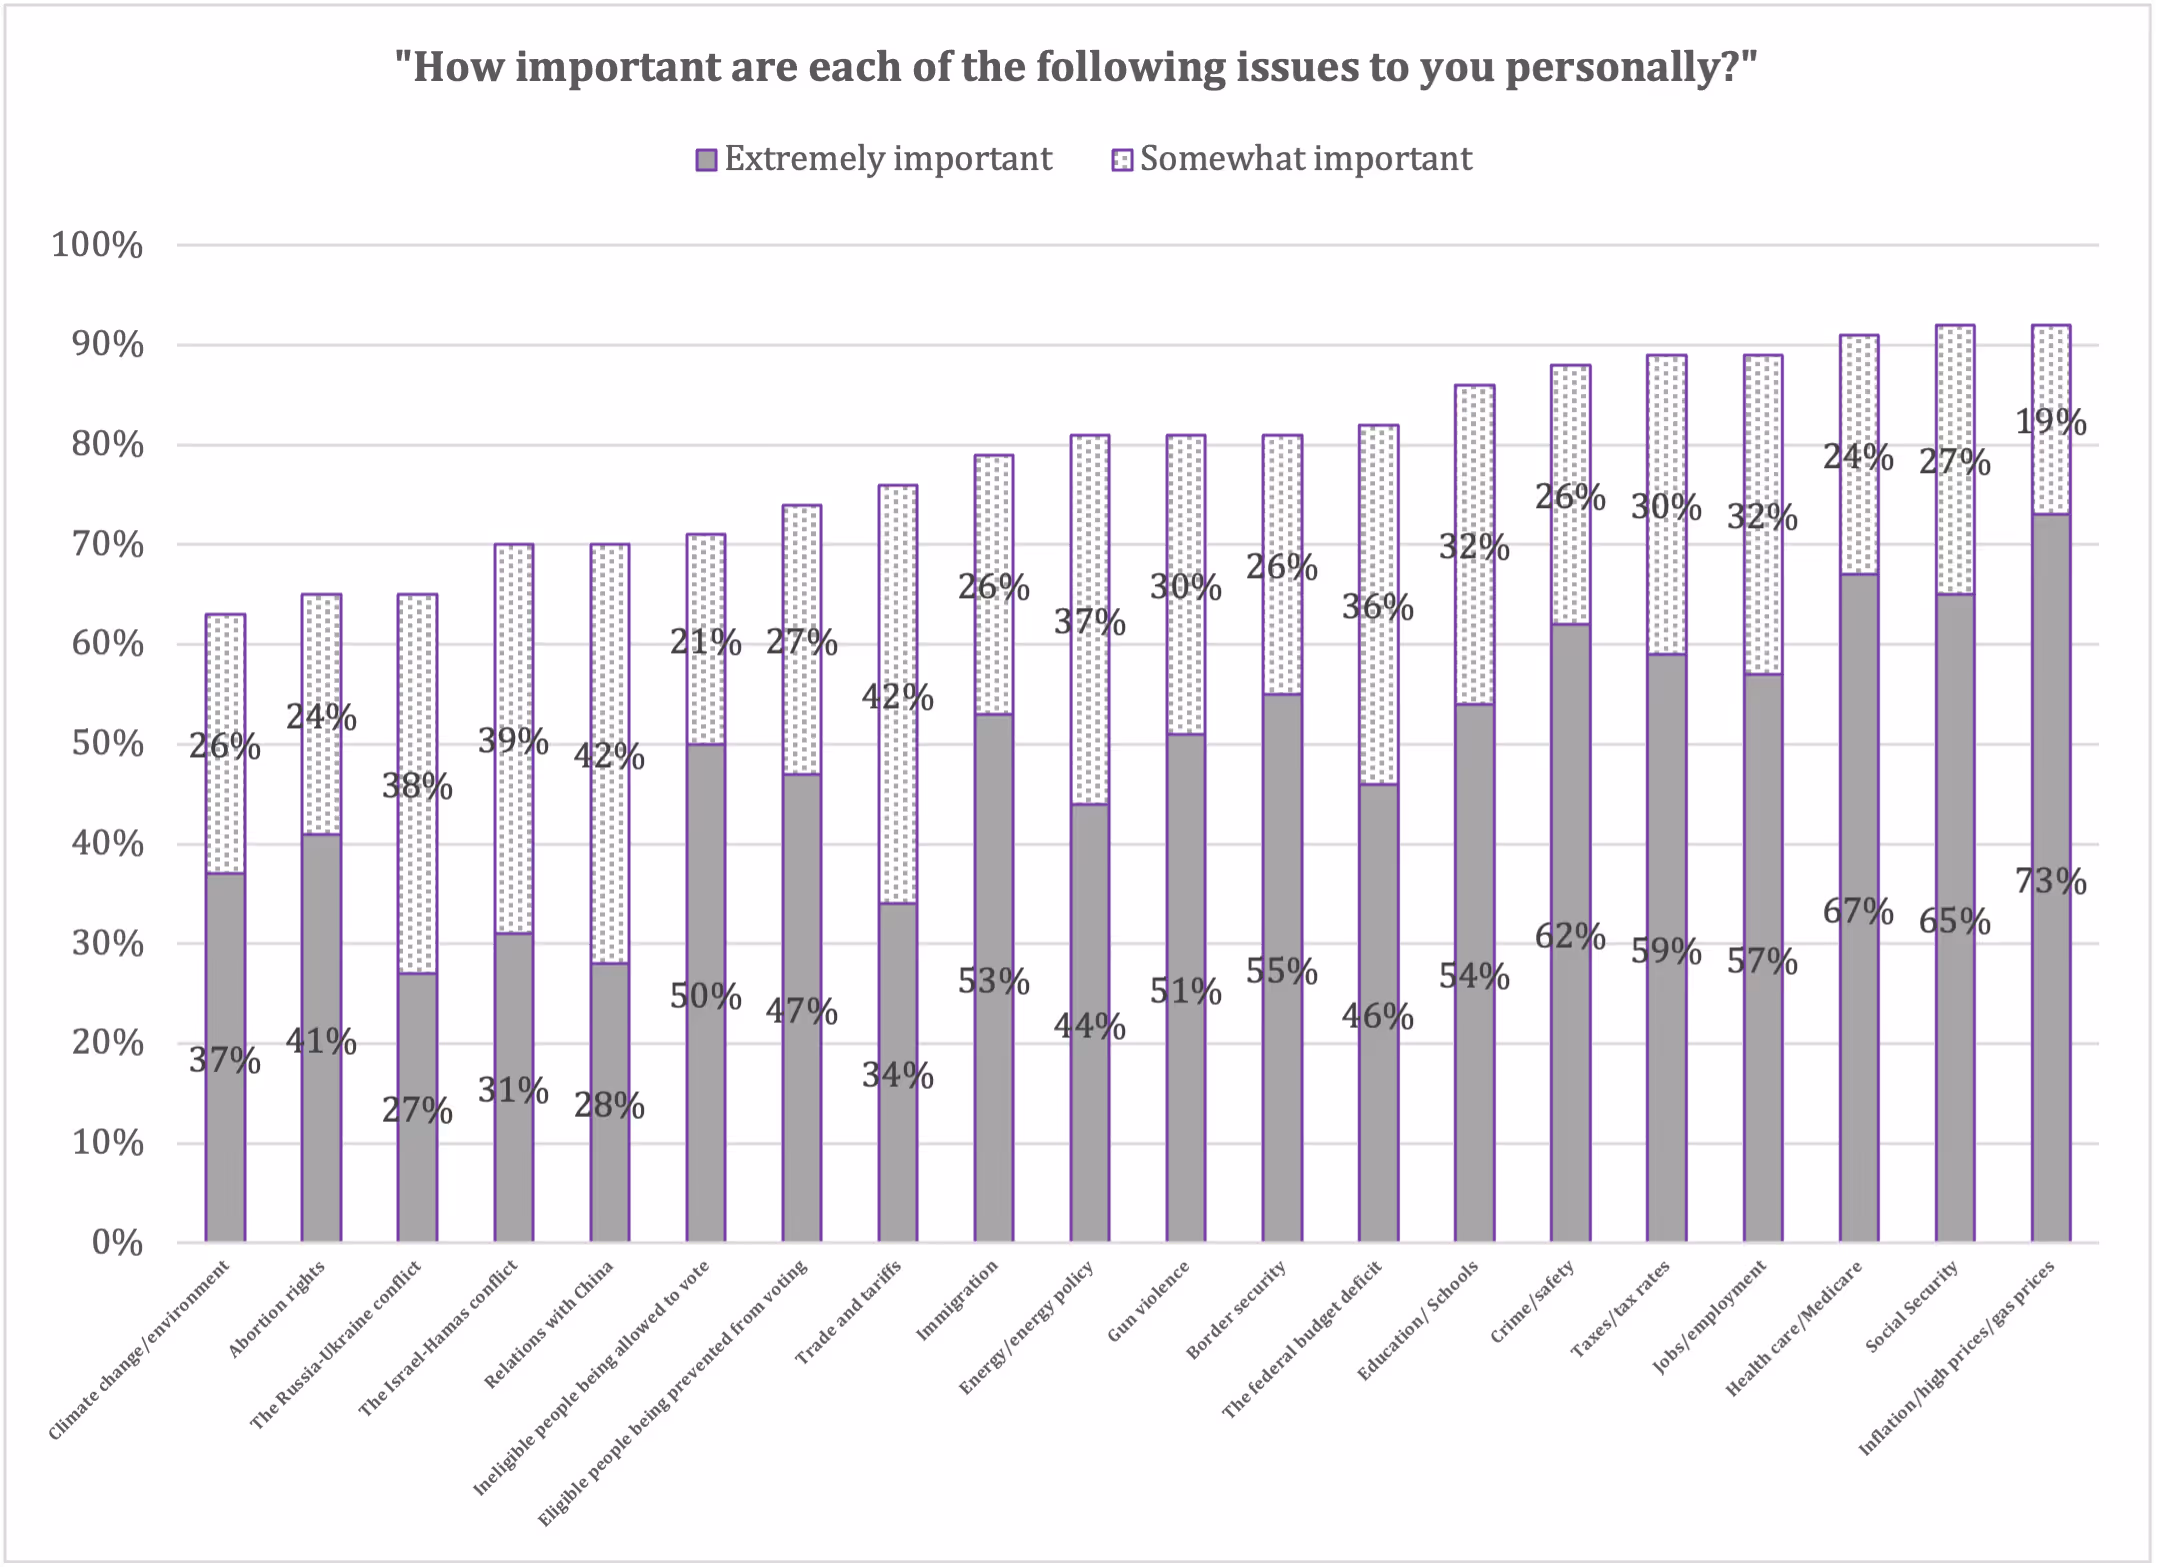
As far as the election is concerned, Trump was advantaged by the prominence of these economic issues. Of those rating inflation/prices, jobs/employment, and taxes/tax rates as “extremely” important, Trump won the vote over Harris by nineteen, six, and sixteen points, respectively. He also carried those citing the budget deficit as “extremely” important by twenty-seven points.
Trump’s greatest margins over Harris were among voters citing border security and immigration as “extremely” important to them personally (forty-six and forty points, respectively). Furthermore, Trump managed to reach a “draw” on the traditionally Democratic issue of Social Security, where voters preferred Harris by only a single point among those citing the issue as “extremely” important.
Harris’ top two issues—climate change and abortion—were judged as “extremely” or “very” important personally by 63% and 65% of voters; that seems impressive, but these were the two lowest scoring issues that we tested.
Number 4: Voting is not that hard
When asked how difficult it is to vote, 85% of voters say it was “extremely” (57%) or “very” (28%) easy. Another 7% say it is “somewhat” easy. Only 1% say it was “somewhat” difficult while no one in the sample says voting was “very” or “extremely” difficult.
Among voters under 30, 90% said voting was easy while 2% say it was “somewhat” difficult. Among racial and ethnic groups, 1% of white voters say it was “somewhat” difficult, compared to 4% of Black voters and 2% of Hispanic voters.
Similarly, Americans also say that they found it easy to learn about the candidates running for national office in 2024. Two-thirds (66%) rated this as “extremely” or “very” easy, while another 21% said it was “somewhat easy.” Only 5% say learning about the candidates was difficult.
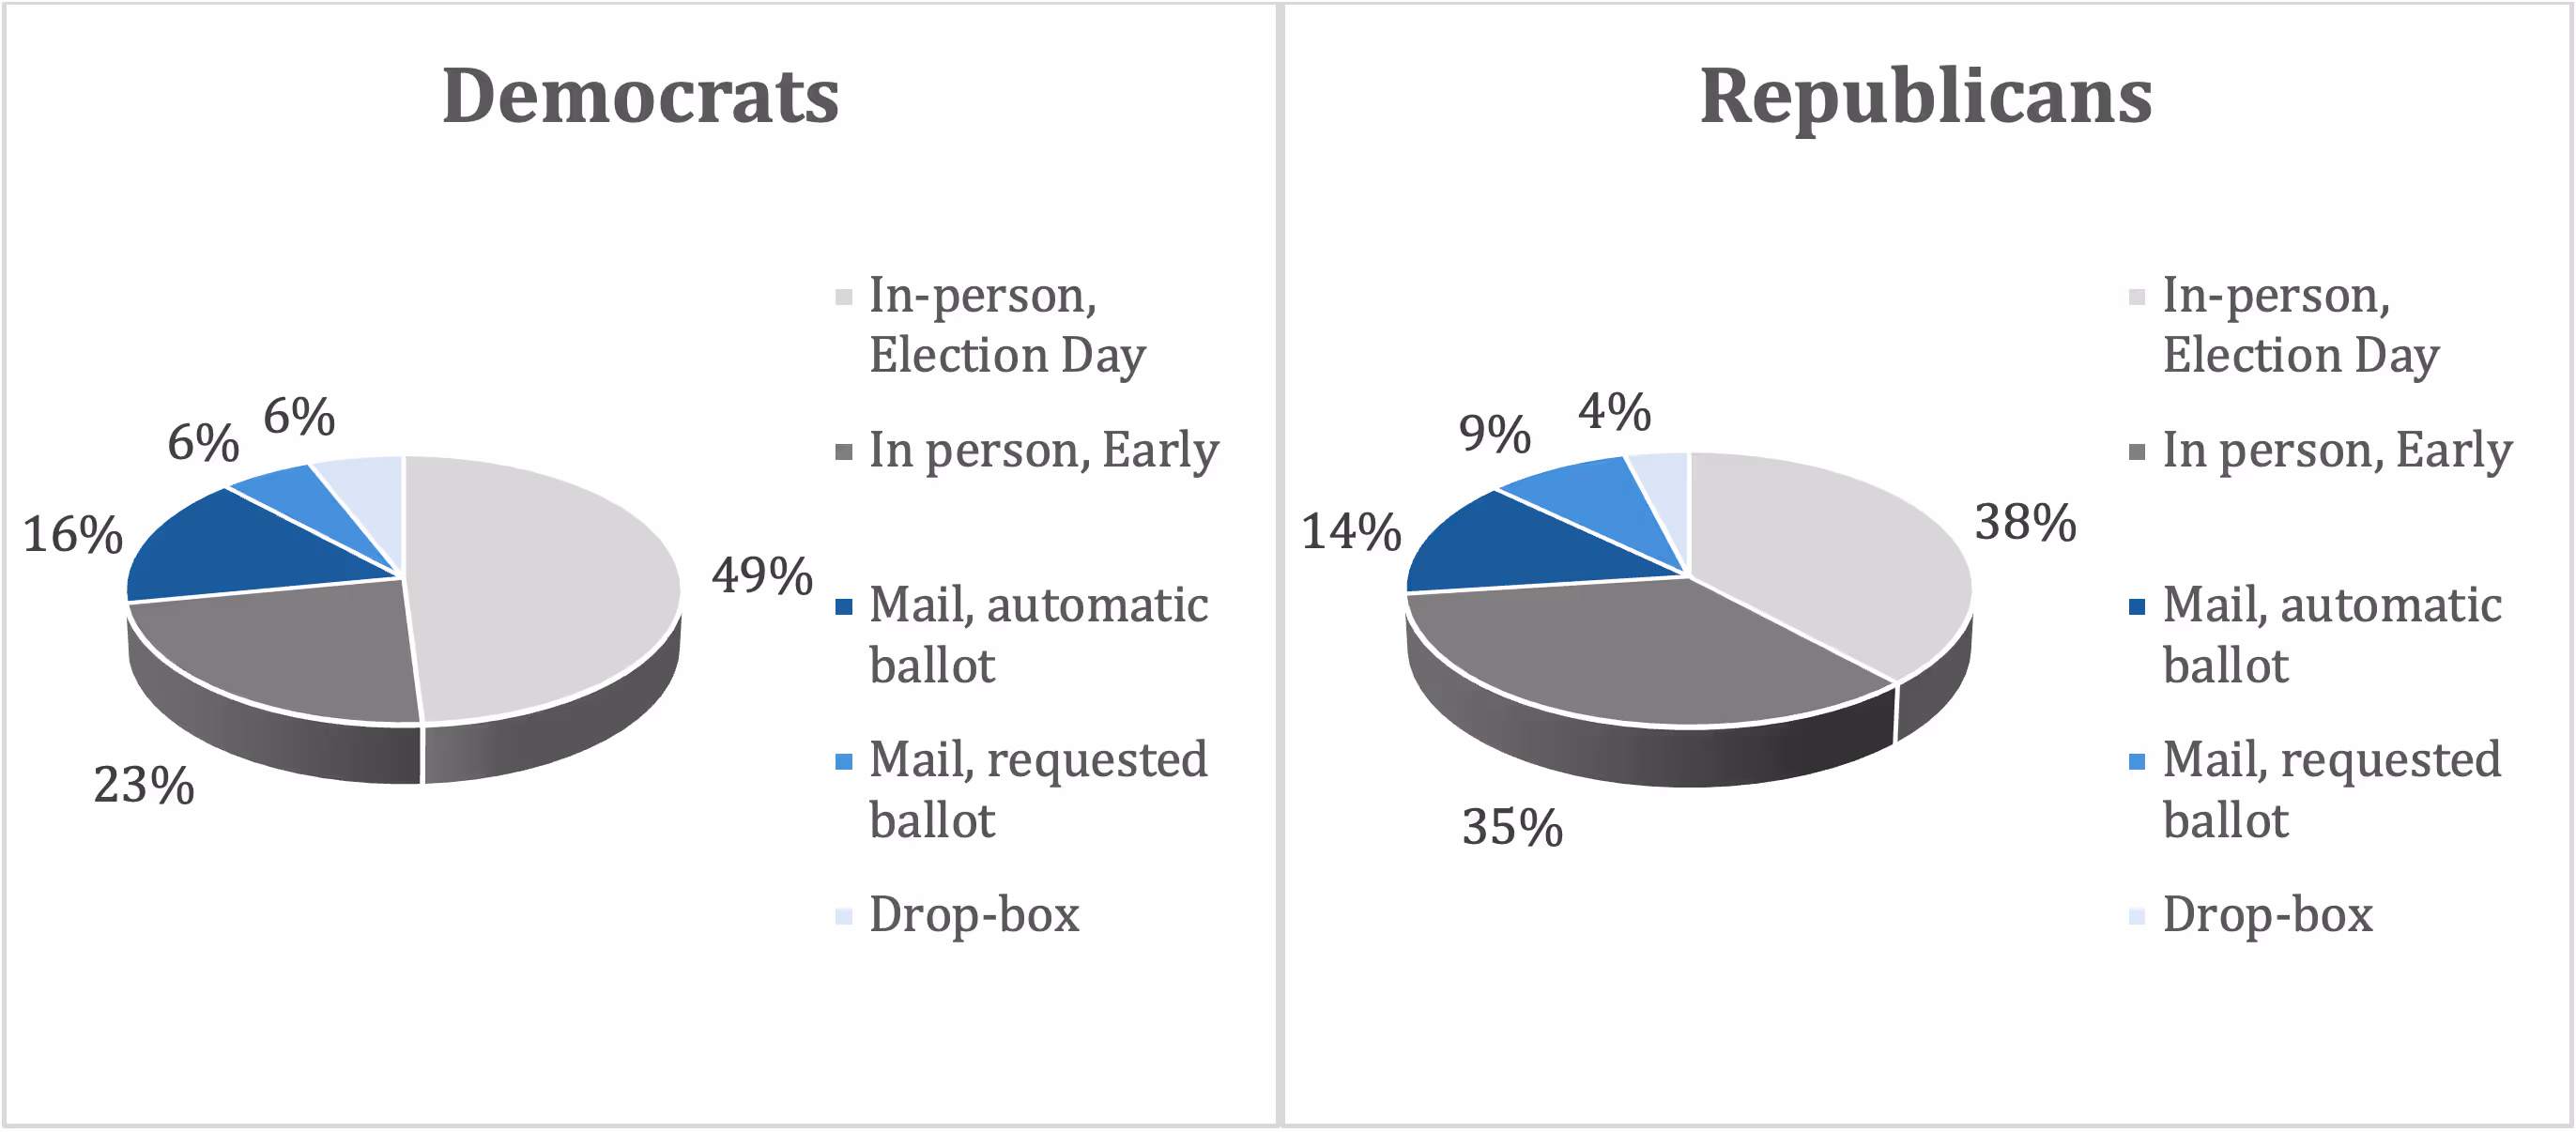
All told, 42% of Americans say they cast a ballot in person on Election Day, while 29% voted in person early, 15% voted early by a mail ballot they automatically received, 9% voted by a mail ballot they requested, and 5% voted by drop-box. In 2020, much was made of the Democratic advantage with respect to convenience voting, and especially mail-in voting. In 2024, 73% of Republicans voted in-person (38% on Election Day and 35% early) whereas 72% of Democrats voter in-person (49% on Election Day and 23% early). Twenty-seven percent of Republicans voted by mail (14% by automatic mail ballot, 9% by requested ballot, and 4% by drop-box) while 26% of Democrats did likewise (16% by automatic ballot, 6% by requested ballot and 6% by drop box).
The political parties seem to have been effective at reaching out to voters and trying to get them to the polls. About one-third of voters were contacted by representatives of both parties during the election campaign, while another 15% said only the Democrats contacted them and 9% said only the Republicans contacted them. Less than half (45%) said neither side contacted them.
The dominant mode of outreach was text message, as 37% of voters said they were contacted via text. The next most common modes were direct mail (31%), email (30%), phone call (23%), and in-person (12%).
Number 5: Democrats and Republicans are concerned about institutions that the other side controls
Fifty-eight percent of Americans are concerned that the president might try to take away their freedoms and rights (43% extremely concerned). Unsurprisingly, though, the party divide is stark: the numbers are 85% of Democrats (67% extremely) versus 27% of Republicans (17% extremely). Among independents, the number is 55% (40% extremely).
The same partisan divide exists for other branches of government. Seventy-eight percent of Democrats fear the House of Representatives might try to take away rights and freedoms, compared to 23% of Republicans and 55% of independents. For the Supreme Court, it’s 82% of Democrats, 29% of Republicans, and 50% of independents.
Despite concerns about one side running roughshod over their own side, voters do not necessarily embrace divided government. Just under half the electorate (47%) say they prefer unified control of government, while 29% prefer divided government and 24% say they don’t know or “it depends.”
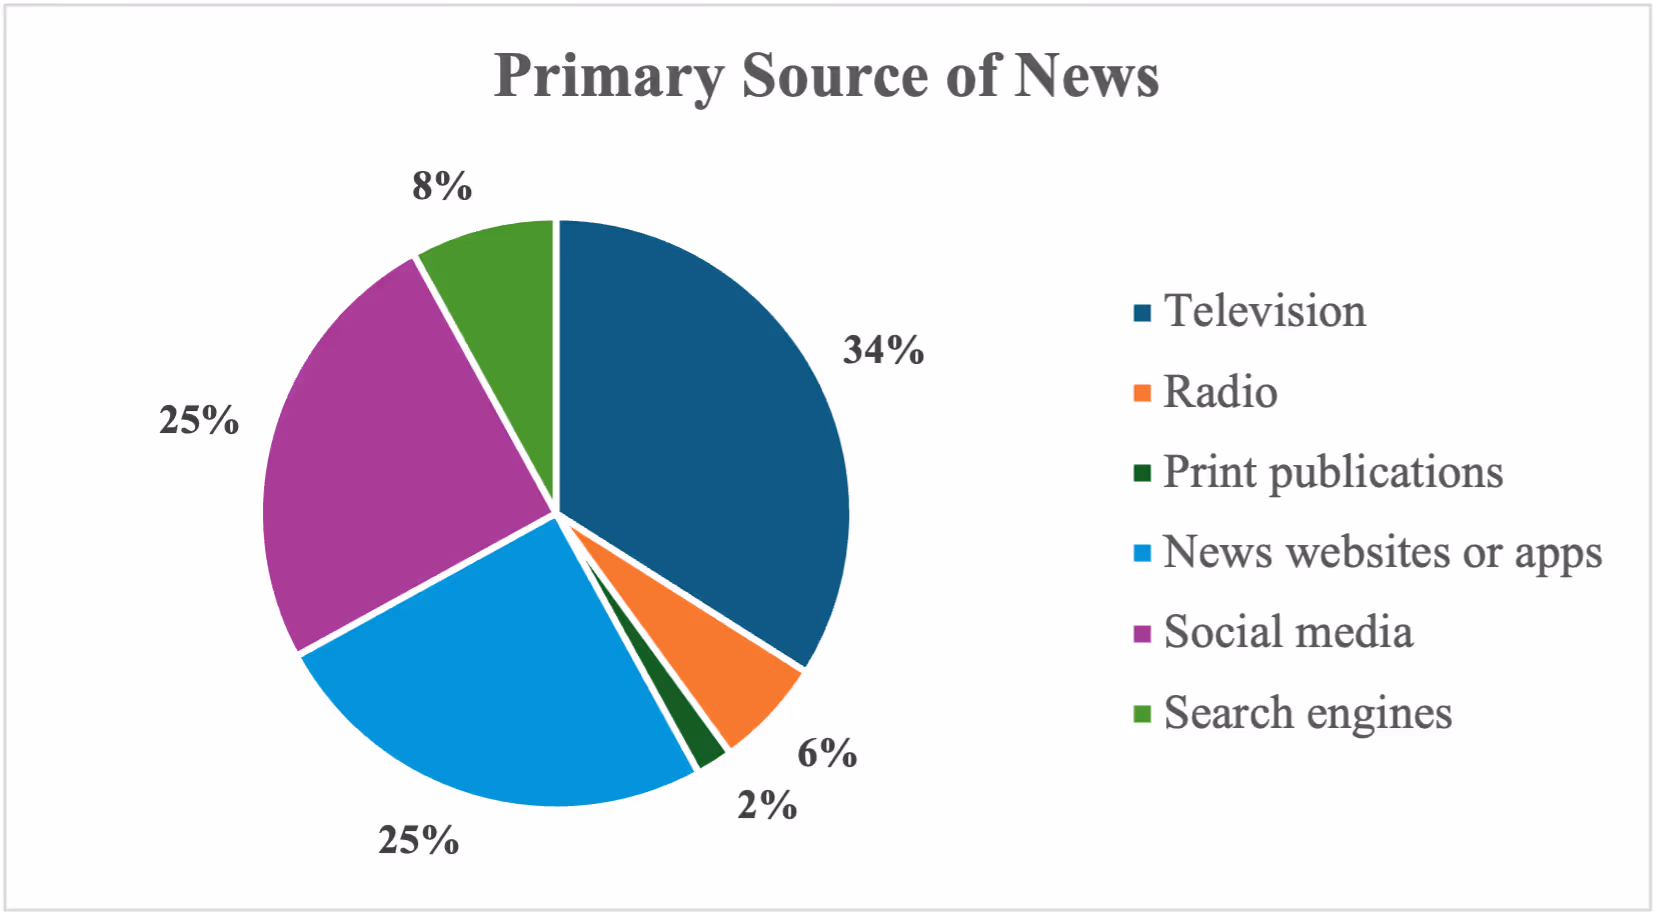
Number 6: Media consumption and the age divide. We asked respondents to identify their main source of information about politics and the news of the day. Television remains the most common source of news (34%), followed by social media sites and news websites and apps (25% each). These patterns, however, conceal enormous differences by age. Among those under 30, 57% list social media as their main source of news, whereas 15% say TV. Among seniors, 44% say TV and 4% say social media.
When asked about specific news sources, among those who get their information from television, 49% identified Fox News as a main source (75% of Republicans), 34% said CNN (54% of Democrats), 21% said MSNBC (35% of Democrats), and 64% said local news (including a majority of Democrats, Republicans, and independents).
Among those who prefer social media sites to get their news, 64% go to X/Twitter, 60% go to Facebook, 39% go to Instagram (51% of those under 30), 29% go to TikTok (33% of those under 30), 14% go to Reddit, and 10% go to LinkedIn.
For those who get their news mainly from news websites or apps, 49% said they mainly go to CNN 66% of Democrats), 47% said they mainly go to a local news site or app, 34% said Fox News (56% of Republicans), 26% said the New York Times, 17% said the Wall Street Journal, 13% said the Washington Post, and 6% said Breitbart.
Methodology
From November 7-12, 2024, YouGov interviewed 1,283 registered voters who were then matched down to a sample of 1,200 to produce the final dataset. The respondents were matched to a sampling frame on gender, age, race, and education. The sampling frame is a politically representative "modeled frame" of U.S. registered voters, based upon the American Community Survey (A.C.S.) public use microdata file, public voter file records, the 2020 Current Population Survey (C.P.S.) Voting and Registration supplements, the 2020 National Election Pool (N.E.P.) exit poll, and the 2020 C.E.S. surveys, including demographics and 2020 presidential vote.
The matched cases were weighted to the sampling frame using propensity scores. The matched cases and the frame were combined and a logistic regression was estimated for inclusion in the frame. The propensity score function included age, gender, race/ethnicity, years of education, and region. The propensity scores were grouped into deciles of the estimated propensity score in the frame and post-stratified according to these deciles.
The weights were then post-stratified on Party ID, 2020 presidential vote choice, followed by a four-way stratification of gender, age (four categories), race (four categories), and education (four categories), to produce the final weight.
YouGov surveys are not probability samples, and therefore one cannot technically impute a margin of error. If one assumes that the sample approximates a probability sample on the matched variables, an estimated margin of error can be calculated. For a national sample of 1,200, this estimated margin of error (M.o.E.) is approximately +/- 3.0 percentage points. The estimated M.o.E. will be larger for sub-groups.
Daron Shaw is a senior fellow at the Civitas Institute, as well as University Distinguished Teaching Professor and the Frank C. Erwin, Jr. Centennial Chair of State Government in the Department of Government at UT Austin.
Download Crosstabs
View and download the full crosstab report for the Winter 2024 Civitas Poll.

Politics
%20Richard%20Samuelson%20%20-%20Is%20American%20Nationalism%20Still%20Creed-able_-1.jpg)
Is American Nationalism Still Creed-able?
We are not there now, but there is reason to worry that the United States is in danger, if we are not careful, of ceasing to be a nation with the principles of 1776 at its core.

National Civitas Institute Poll: Americans are Anxious and Frustrated, Creating a Challenging Environment for Leaders
The poll reveals a deeply pessimistic American electorate, with a majority convinced the nation is on the wrong track.
.webp)
%20(1).avif)


.png)
.png)
.png)

Confronting the New Antisemitism
"The postwar effort 'to rebrand Judaism as a religion' has made it impossible for American Jews to understand what they are facing today, because what we are facing today is an attack on the idea of Jewish peoplehood.”
“Democratic” Socialism Is Undemocratic
By promoting class hatred, suppressing private initiative, and seeking enhanced control of our lives, today’s democratic socialists undermine patriotism and individual initiative—two qualities that have long distinguished the United States from other major nations.